|
To put it simply, the market continues to improve over last year. In 2013, we saw a slow start to sales in the spring. By the end of the year, 2014 sales did surpass 2013. However, it may be helpful to keep this information in mind when comparing home sales now and spring of 2014. Here are some highlights: -April 2015 had 11% more sales than April 2015. - In April 2015 the median sale price was 10% higher than 2014 and 14% higher than 2013. -The median days on the market is down 14% when comparing April 2015 and April 2014. -We've seen a steady decline in median days on the market. The year to date median days on the market has dropped by 24% in the past 4 years. -There were 8% less homes for sale in April 2015 than April 2014. -Year to date contracts 132 up 12% when compared to this time in 2014. 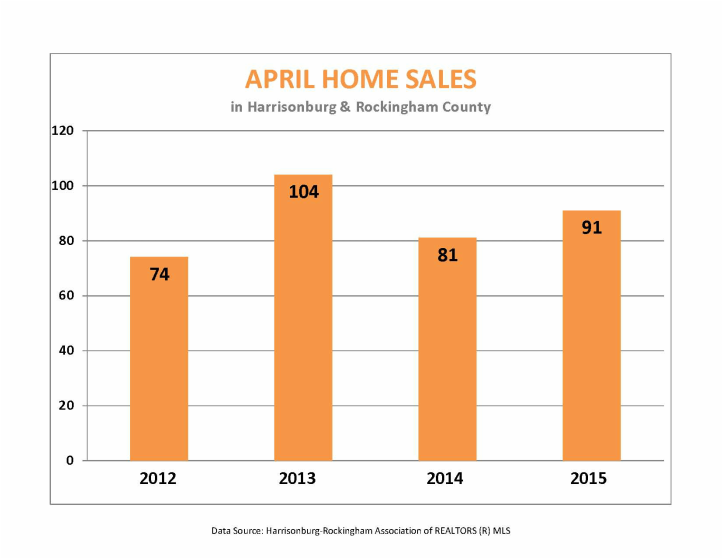 -April 2015 had 11% more sales than April 2015. -April 2015 had 12% less sales than April 2013. 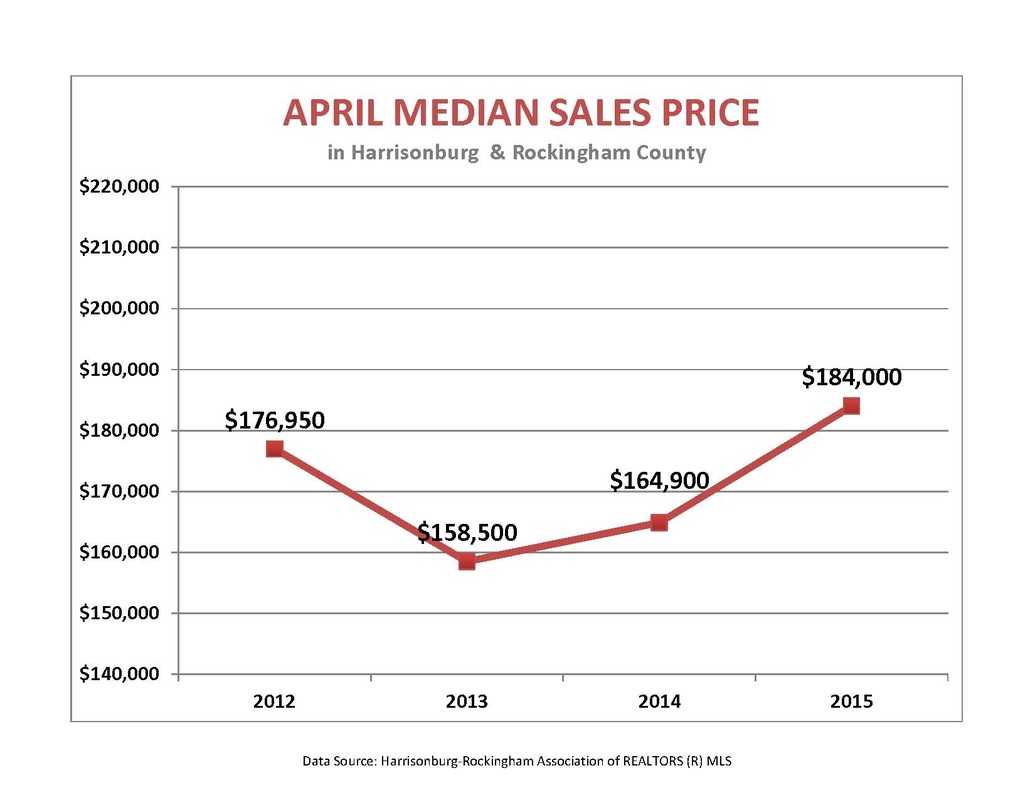 - In April 2015 the median sale price was 10% higher than 2014 and 14% higher than 2013. 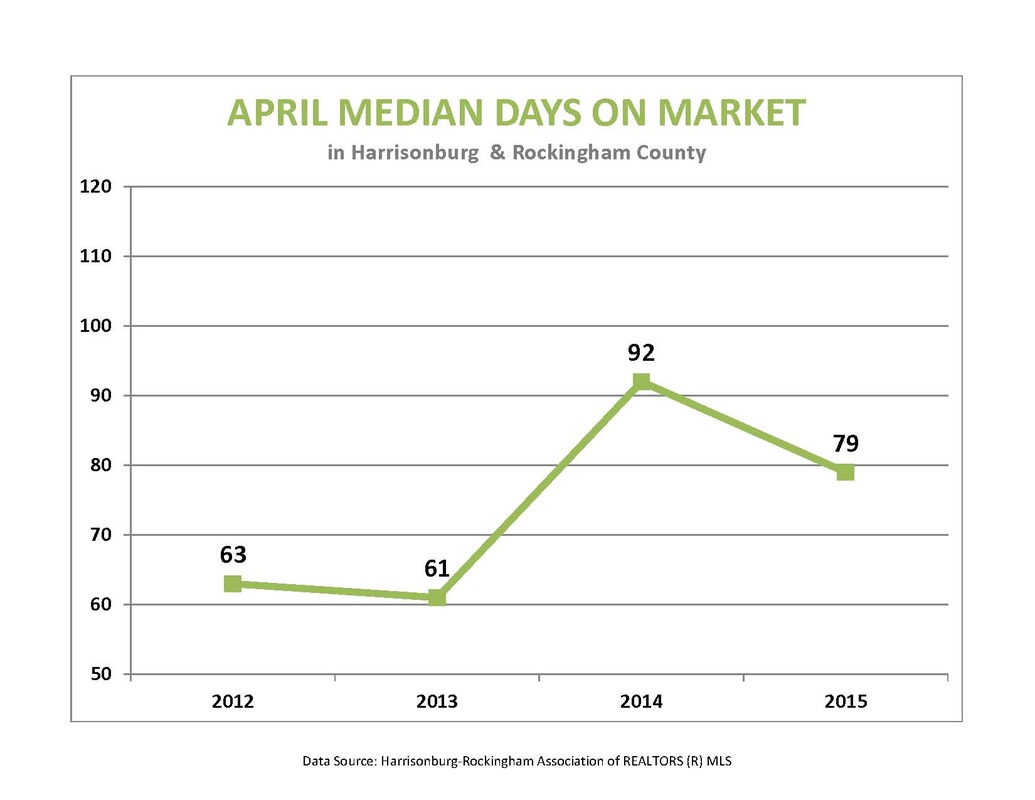 -The median days on the market is down 14% when comparing April 2015 and April 2014. -The median days on the market is up 23% when comparing April 2015 and April 2013. 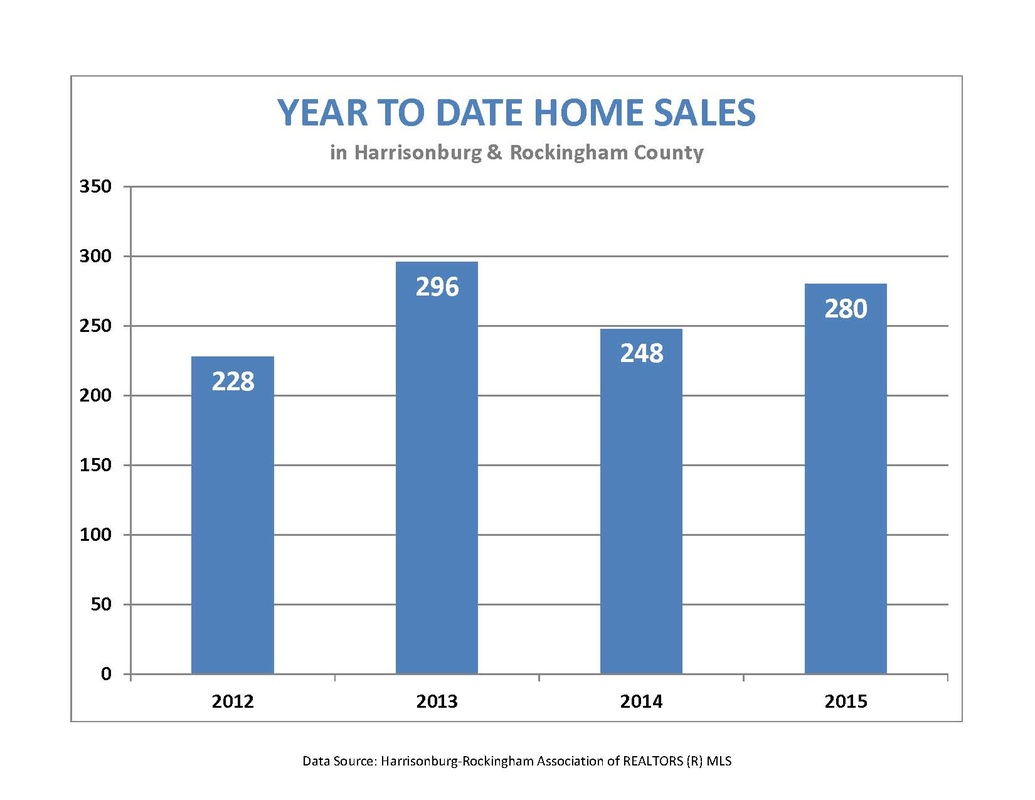 -Year to Date sales are up 11% from this time last year. -Year to Date sales are down 5% from this time 2013. 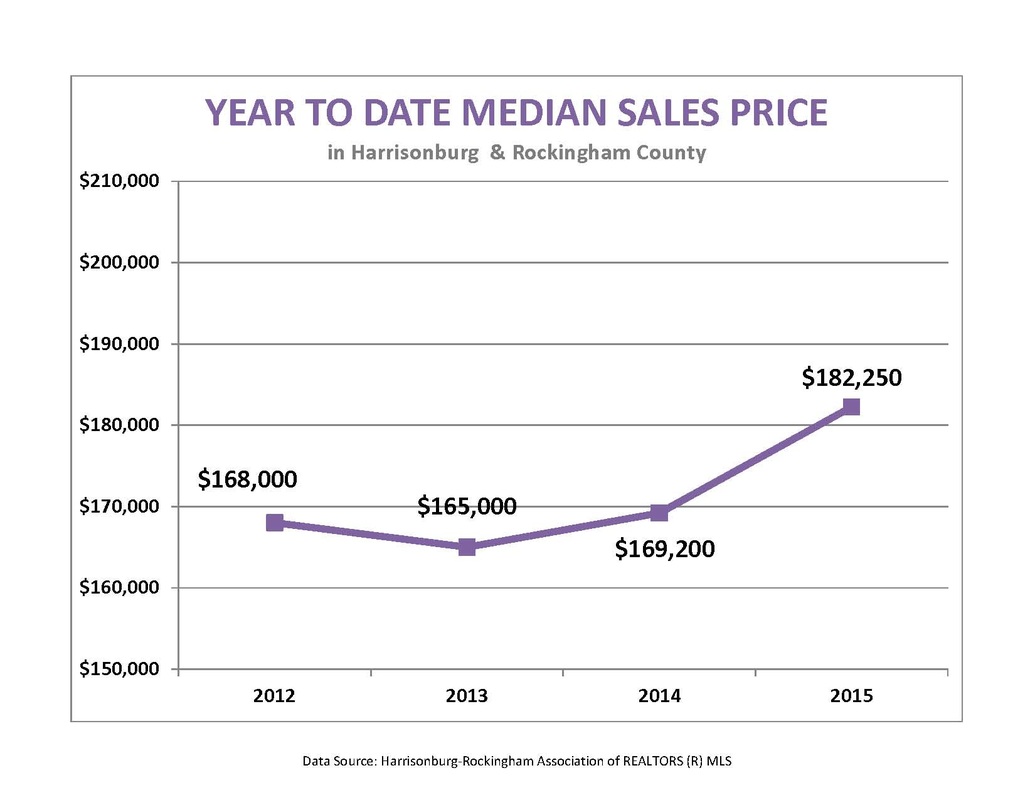 -Year to Date median sales price is up 7% from this time last year. -Year to Date median sales price is up 10% from this time 2013.  -Year to date median days on the market have gone down by 12% from this time last year. -We've seen a steady decline in median days on the market. The year to date median days on the market has dropped by 24% in the past 4 years. 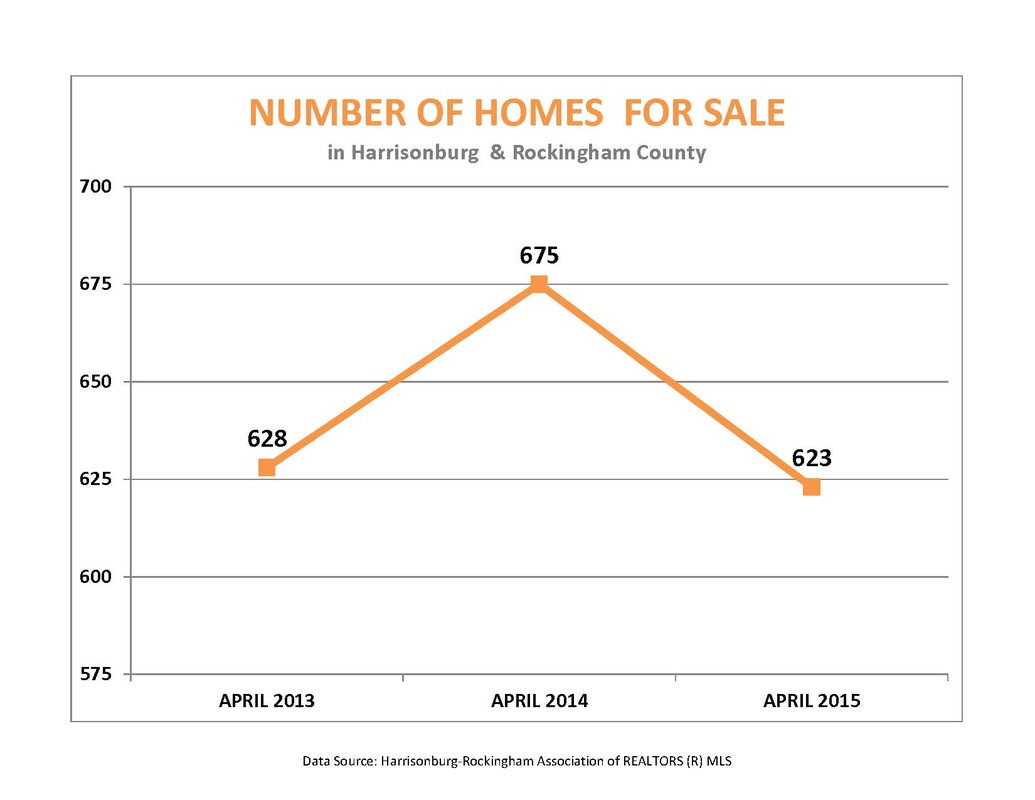 -With a higher volume of sales in 2013 and 2015, it seems natural that the inventory would be higher in 2014. -There were 8% less homes for sale in April 2015 than April 2014. 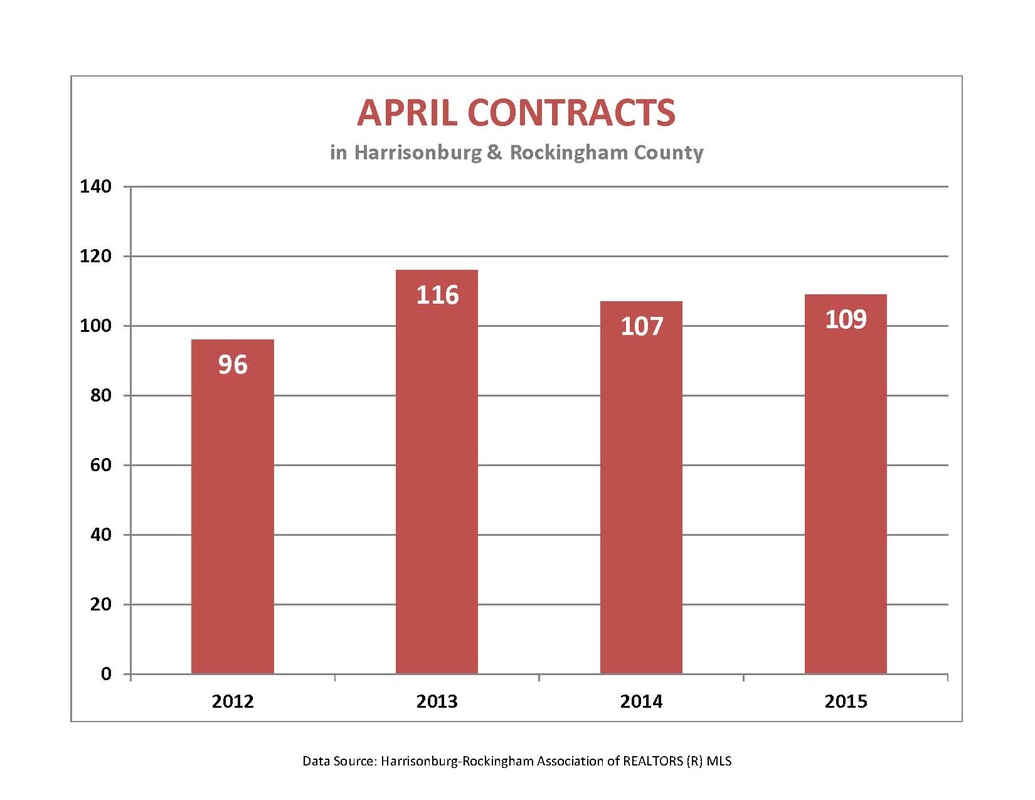 -We had a 2% increase in contracts when comparing April 2014 and April 2015. 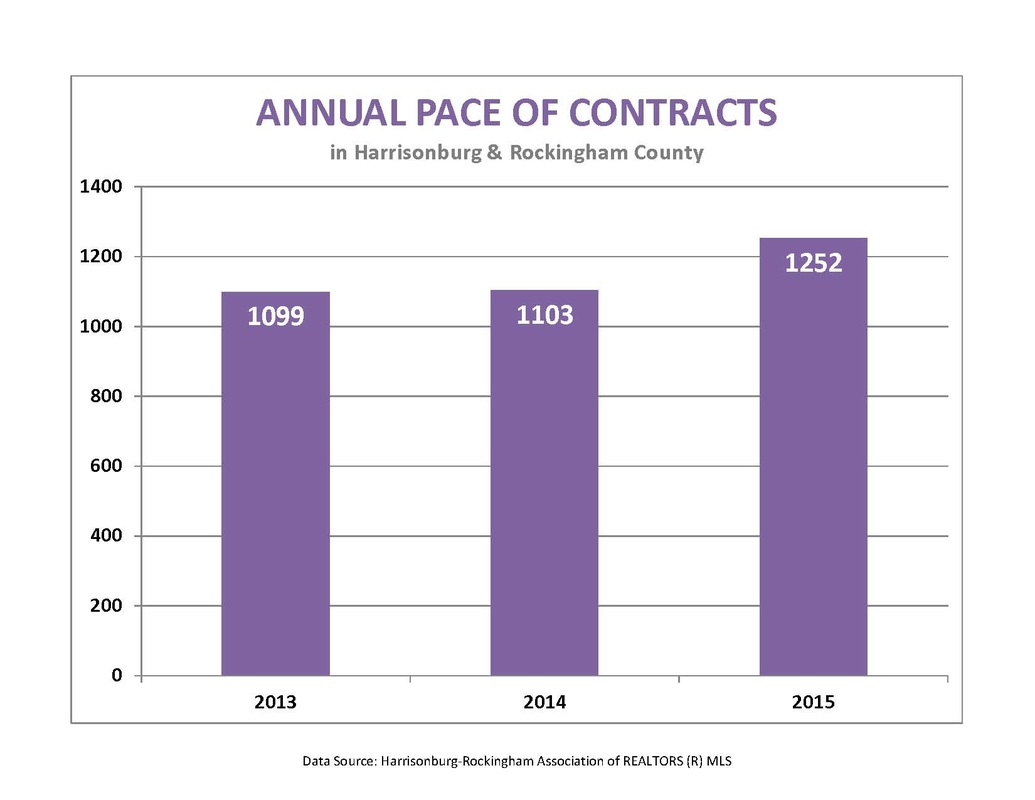 -Year to date contracts 132 up 12% when compared to this time in 2014.
0 Comments
Leave a Reply. |
Categories
All
|
 RSS Feed

|
Email - Click Here
Phone - 540-246-9067 Website - www.mattiasclymer.com Schedule a Meeting, Download Contact Card, Etc... |
Funkhouser Real Estate Group | 401 University Boulevard, Harrisonburg, VA 22801 | 540-434-2400 | ©2021 | Privacy Policy | All rights reserved.
Licensed in the Commonwealth of Virginia