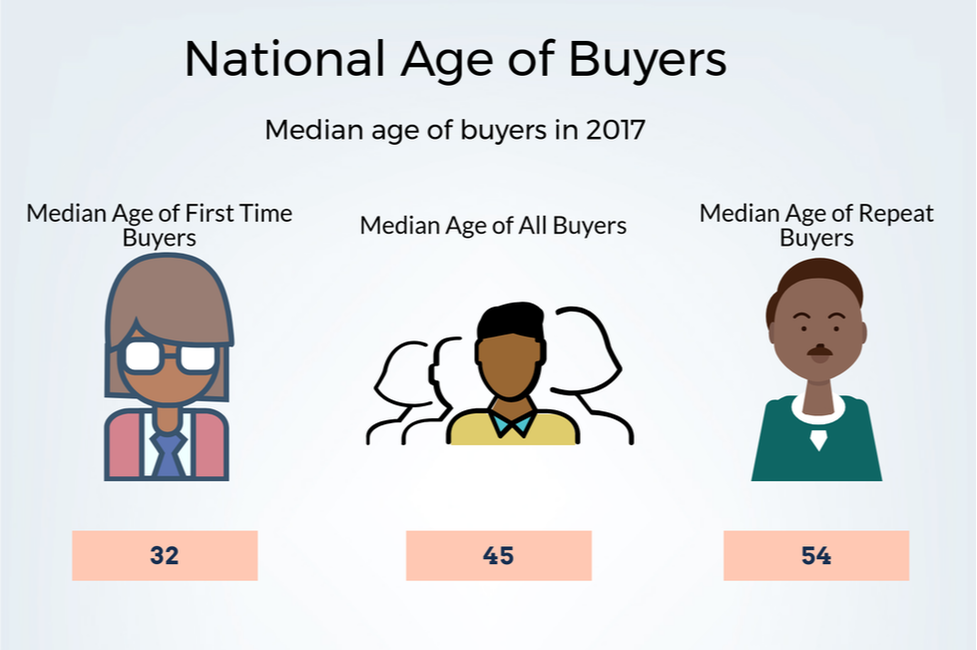
 The infographic above displays the median age for all buyers, first time buyers, and repeat buyers. As we can see from the graph below, the age of first time buyers hasn't changed too drastically since 1981. However, the median age of repeat buyers has increased by 18 years. To analyze why this may be a factor, we have to make some assumptions. It could be assumed that a repeat buyer at 36 could be buying a bigger and/or more expensive house as they have had time to build equity and increased their income. On the inverse, repeat buyers at the age of 54 may be wanting smaller houses. Could the increase of student loans play a factor in the median ages for first time home buyers and repeat buyers going up? Has the cost of living vs the average income become skewed so buyers have to wait to purchase homes? All of these could be factors. I think another large factor could be that first time buyers who bought at the height of the bubble are waiting to make better profits with currently growing market. Let me know if you can think of any other factors that may add to the increased median age of buyers. Source: National Association of Realtors
1 Comment
Research Shows
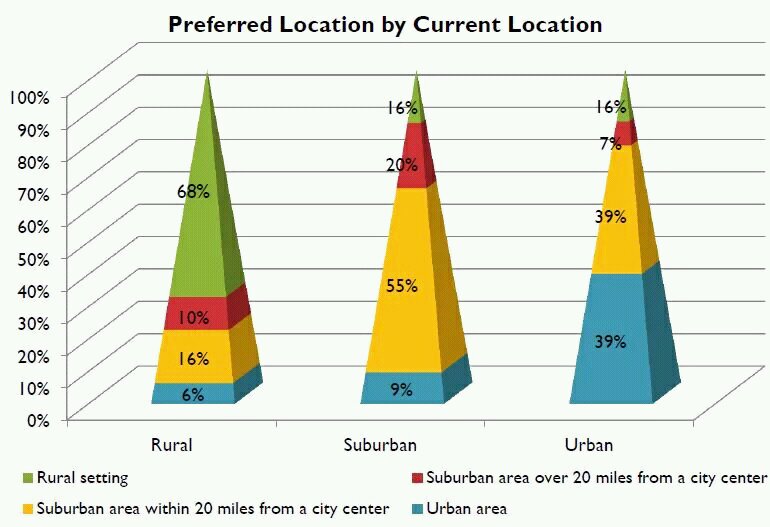
According to this graph from the National Association or Realtors, most people would move to a similar place to where they currently live.
68% of people in rural areas would move to a rural area and 75% of people living in a suburban area would move to a suburban area. An interesting statistic is that only 39% of people living in an urban area would choose to move to an urban area. This leaves the question, if you were to move, would you move to a different location?
Scroll over the graphs to interact with the data. If nothing is showing, click here for the infograph.

Loading...
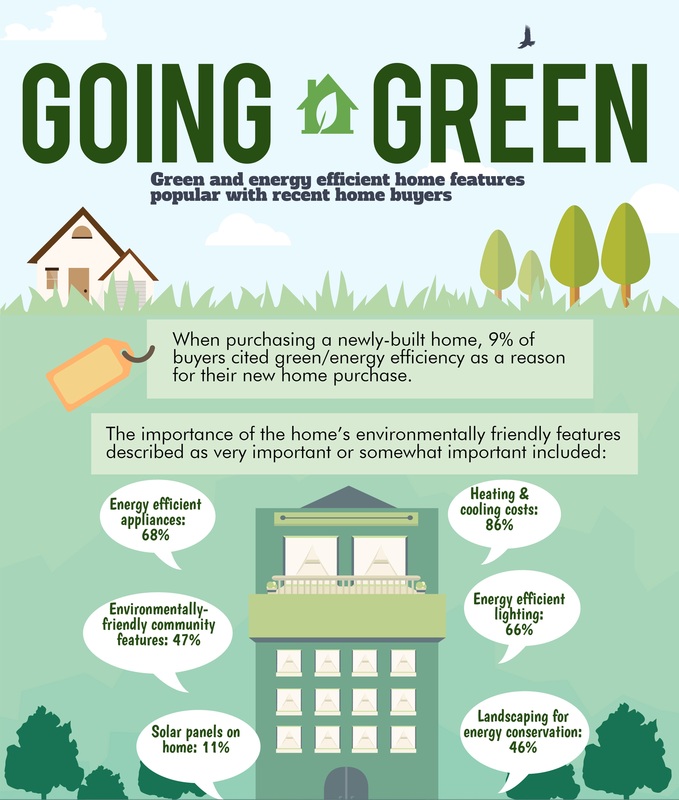
The infographic was created by using statistics from the National Association of Realtors publication, "Recent Home Buyer Profiles."
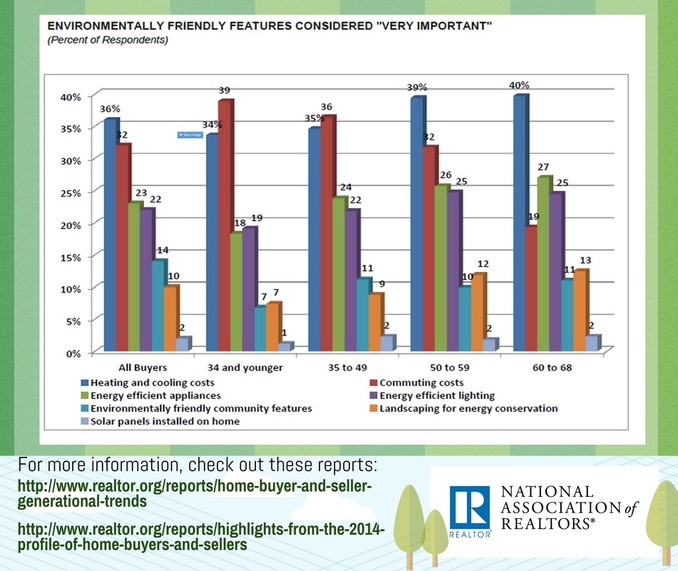
Check out what is important to buyers throughout the United States in regards to environmentally friendly features of a house. What's important to you? Comment and fill out the survey below. Bellow is an interesting graph from the National Associations of Realtors displaying the percentage of house hunters who thought a particular feature was important. The results might surprise you. Take a Moment to Cast your Vote!
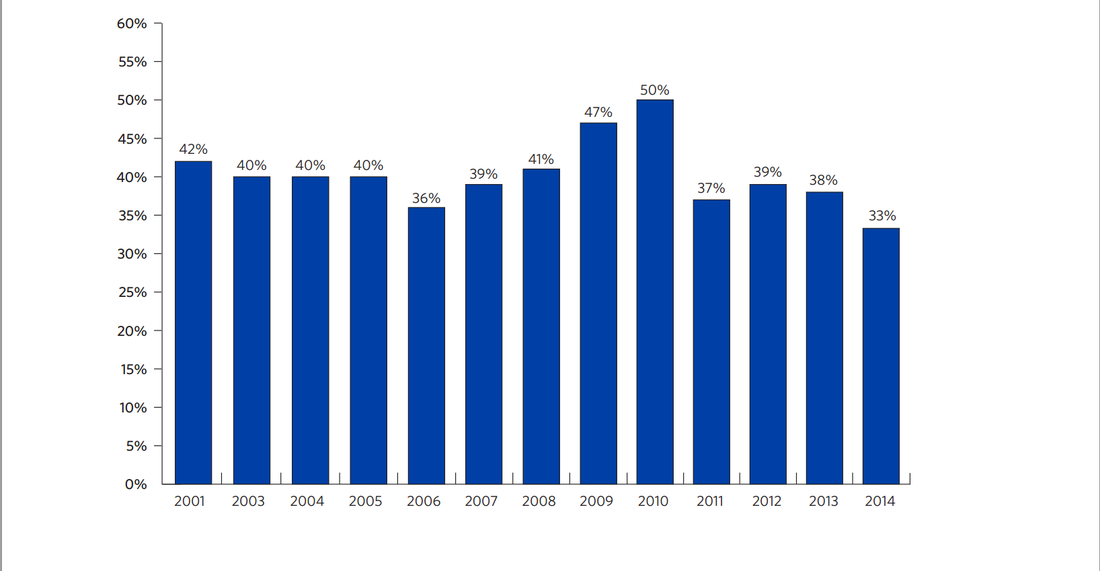
Tightened credit standards is one reason why first-time home owners were less prevalent in 2014 than the historical norms. The demographic make up of first-time home buyers indicates that they are more likely to be single and have a lower income than repeat buyers. First Time Home Buyers |
Categories
All
|

Email - Click Here
Phone - 540-246-9067 Website - www.mattiasclymer.com Schedule a Meeting, Download Contact Card, Etc... |
Funkhouser Real Estate Group | 401 University Boulevard, Harrisonburg, VA 22801 | 540-434-2400 | ©2021 | Privacy Policy | All rights reserved.
Licensed in the Commonwealth of Virginia


 RSS Feed
