|
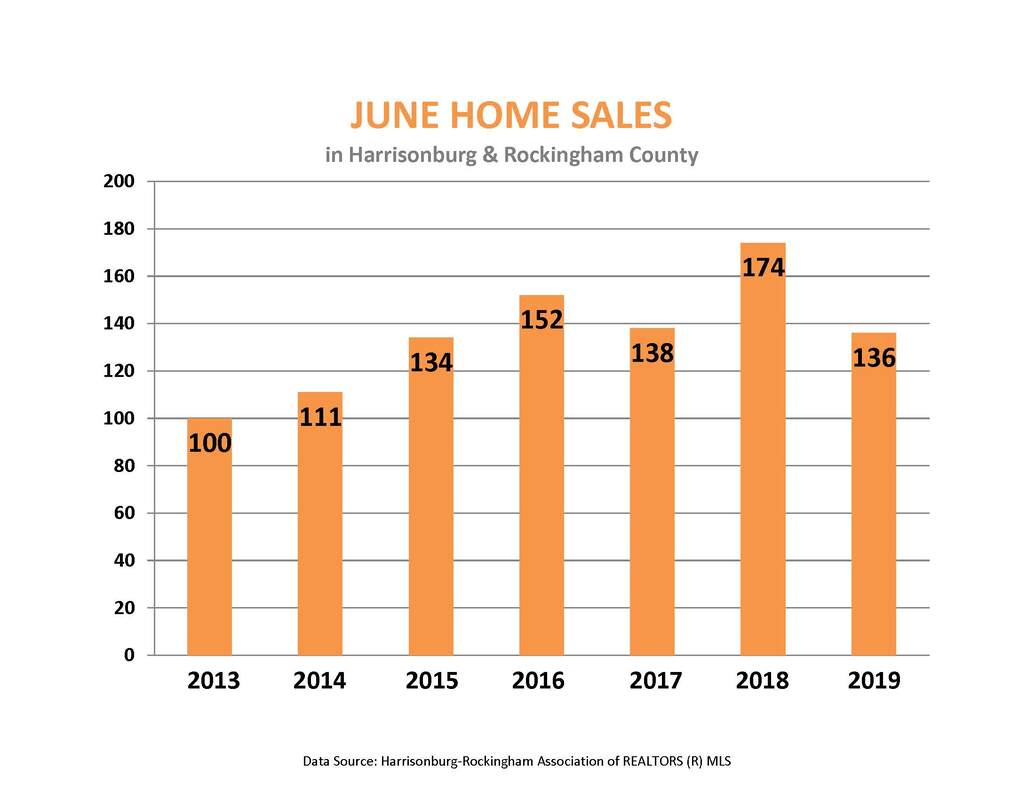
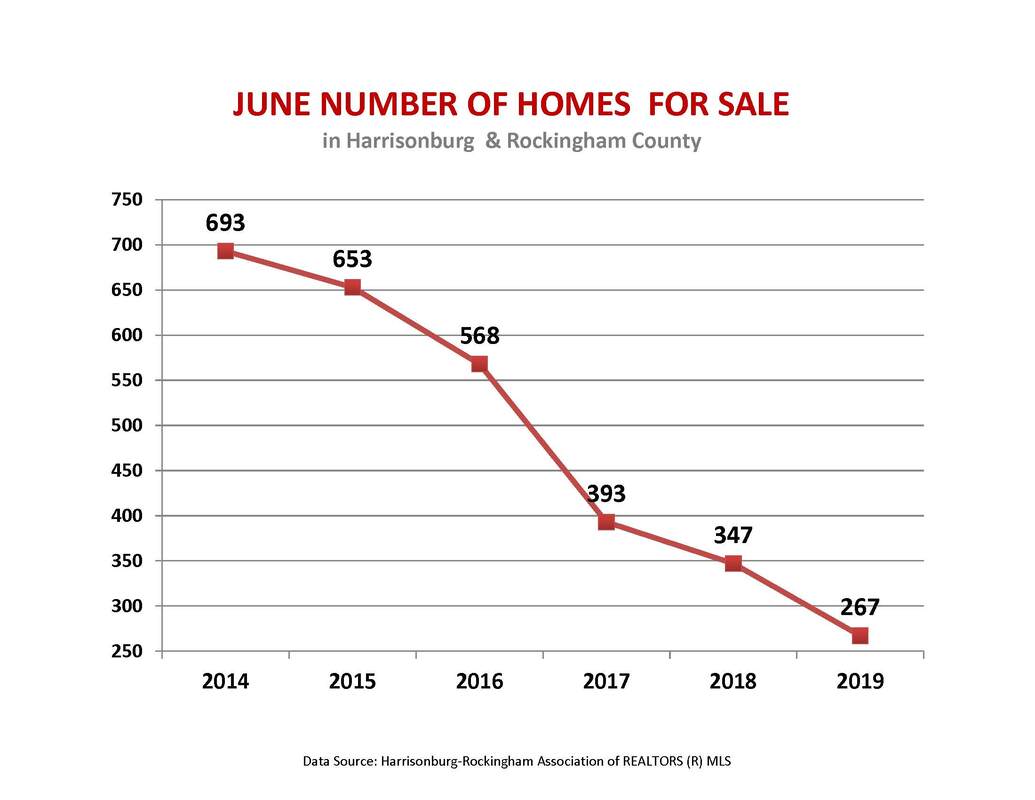
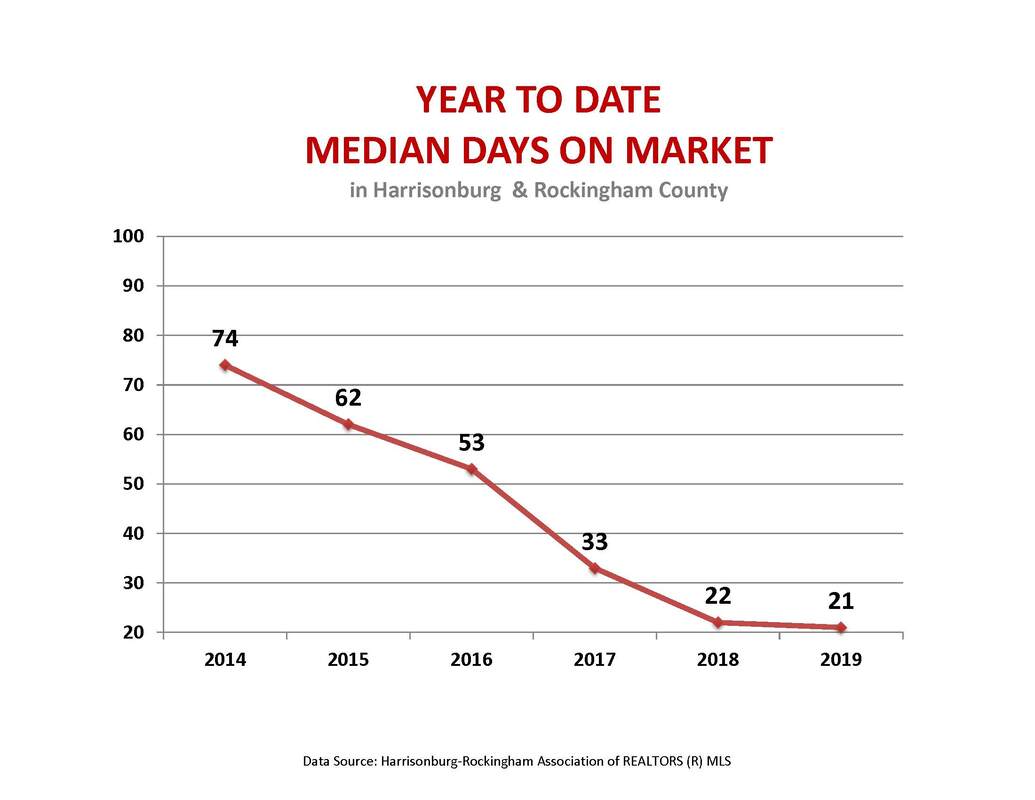
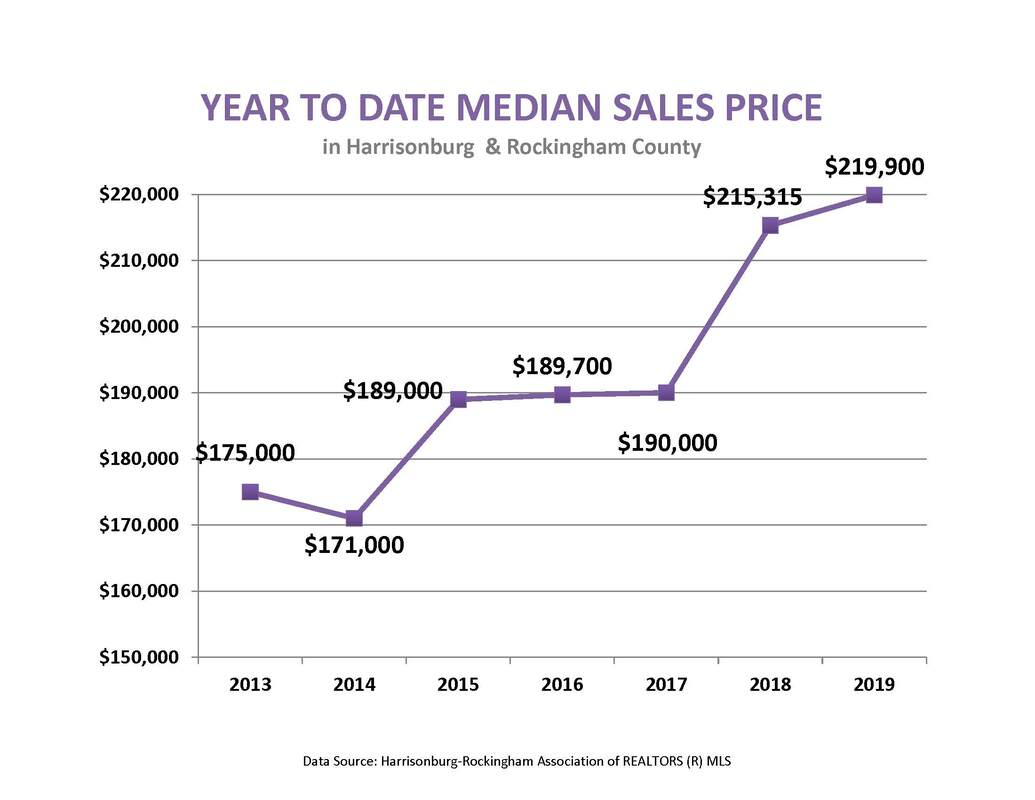
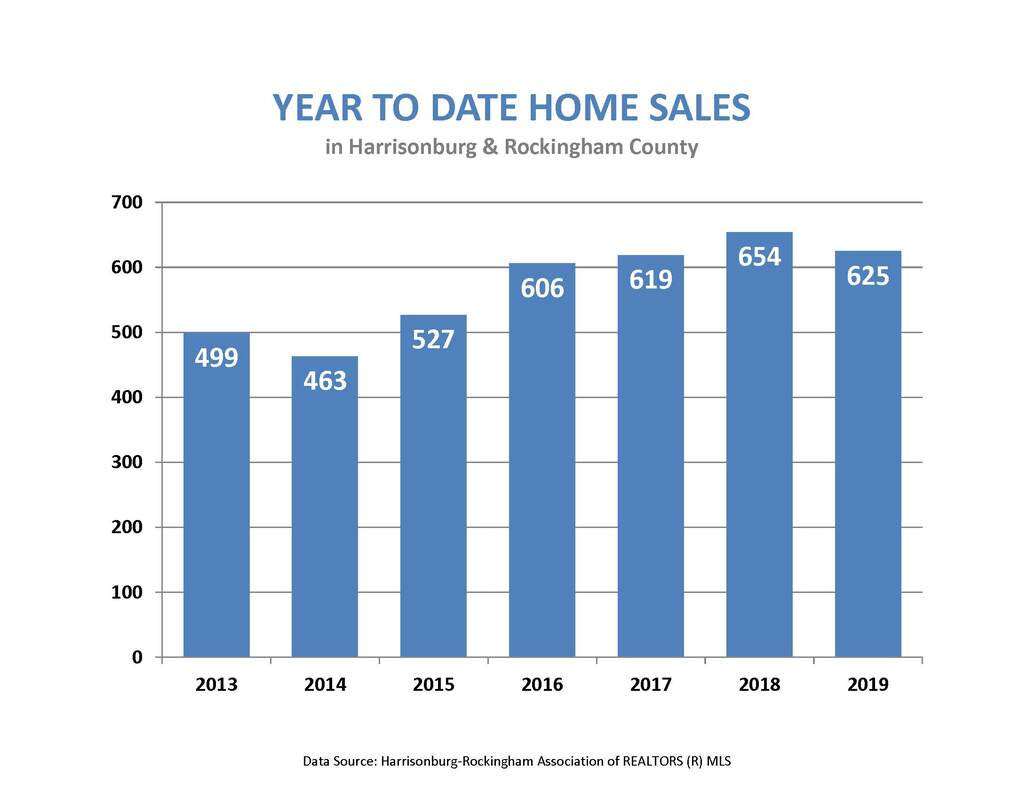
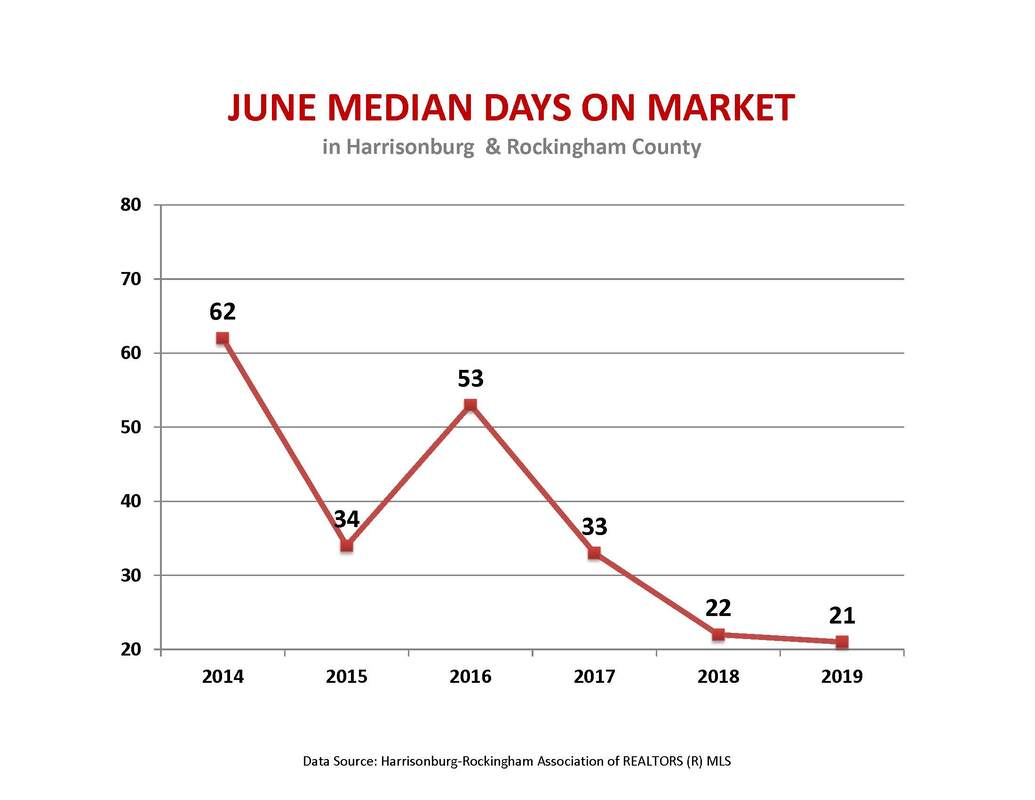
Compared to most other months this year, June was an extremely active month for home sales. However, this is expected as the summer is the busiest season for real estate sales. Sales in June this year (136) were slower than the last 3 years. Additionally, the number of homes on the market is the lowest it has been in June the last 6 years (267). This resulted in the mid year number of homes sold (625) to be 4.43% lower than last year. Although home sales have been slightly slower, the median sales price of homes continues to climb. The median sales price this June was 240,000, 9,500 more than the previous year. Median days on the market continues to drop for the month of June, albeit just by one day from last year (22 to 21). The market very much remains a sellers market.
0 Comments
 The Market Report for Virginia Realtors showed an increase in home sales for the month of May compared to last year. This is the first increase in 8 consecutive months. Prior to this month, sales activity has been flat or declining compared to last year. The increase in May was largely the result of several specific areas experiencing significant growth throughout the state. The area with the most growth throughout all of Virginia compared to last year was right here in the Valley! There were 708 sales in the Valley in May, which is 104 more than last year, equating to an increase of 17%. Hampton Roads and Central Virginia were the other two regions that experienced significant growth.
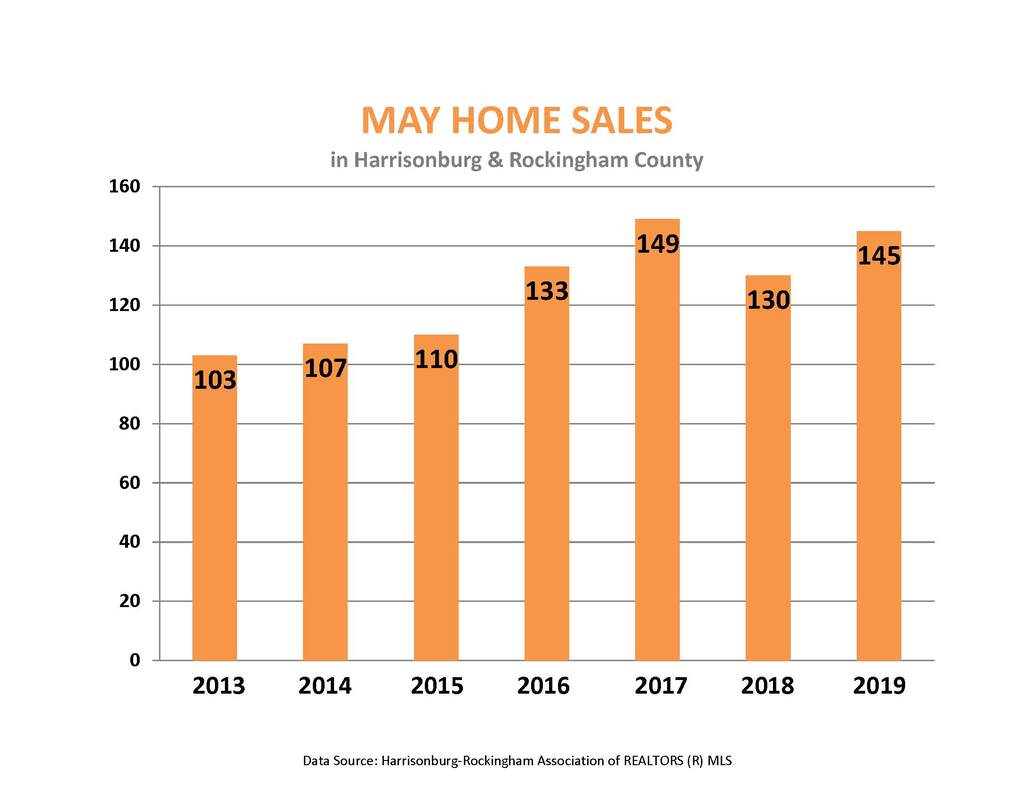
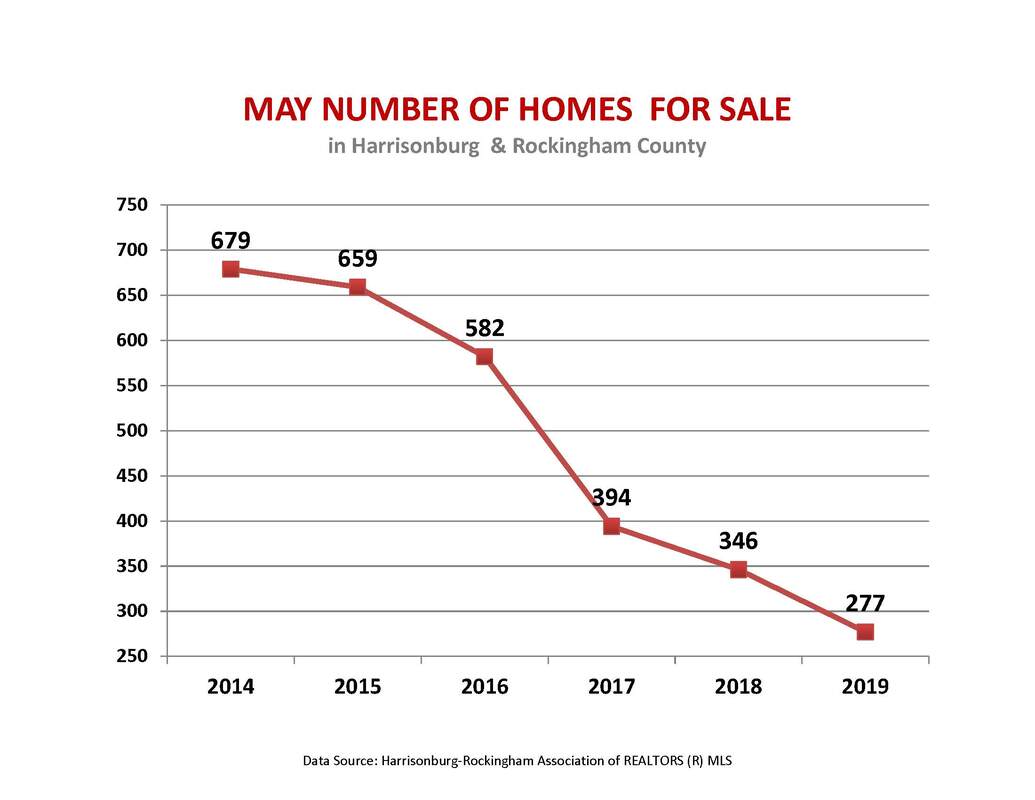
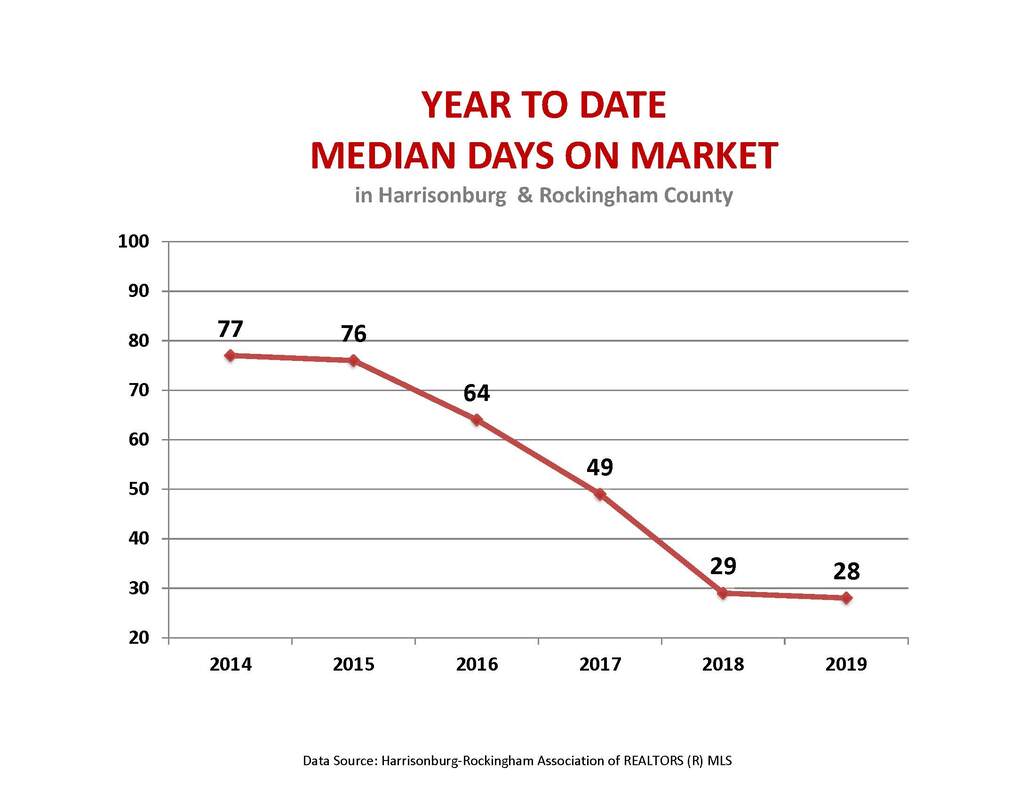
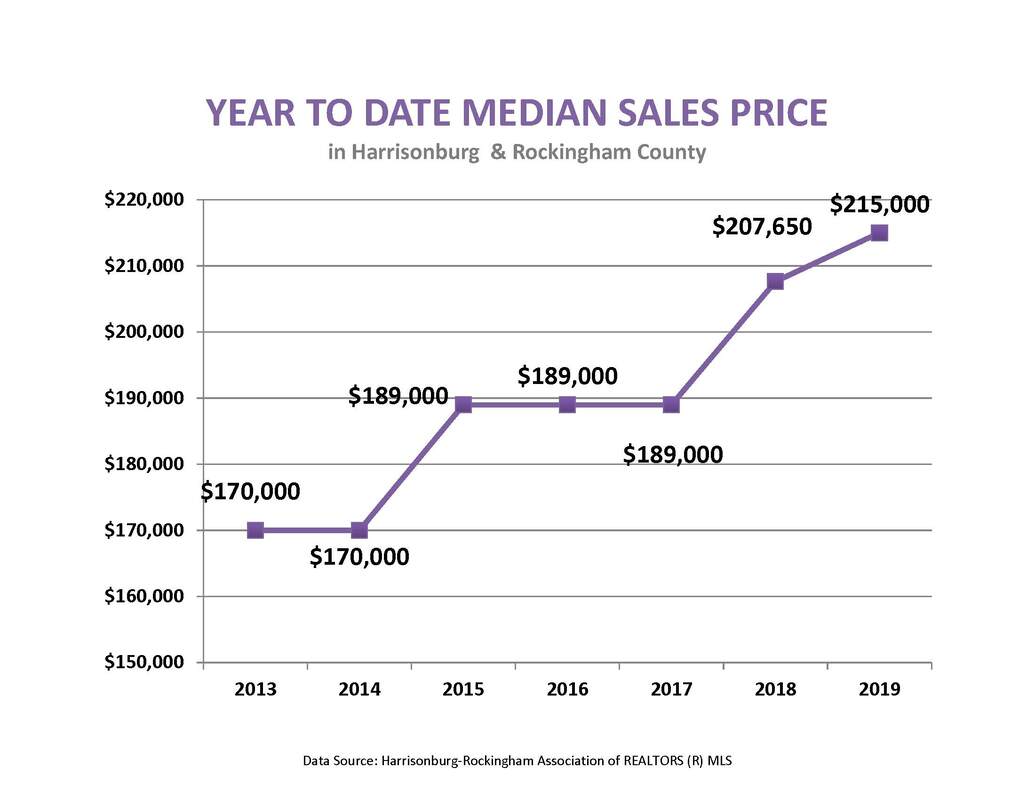
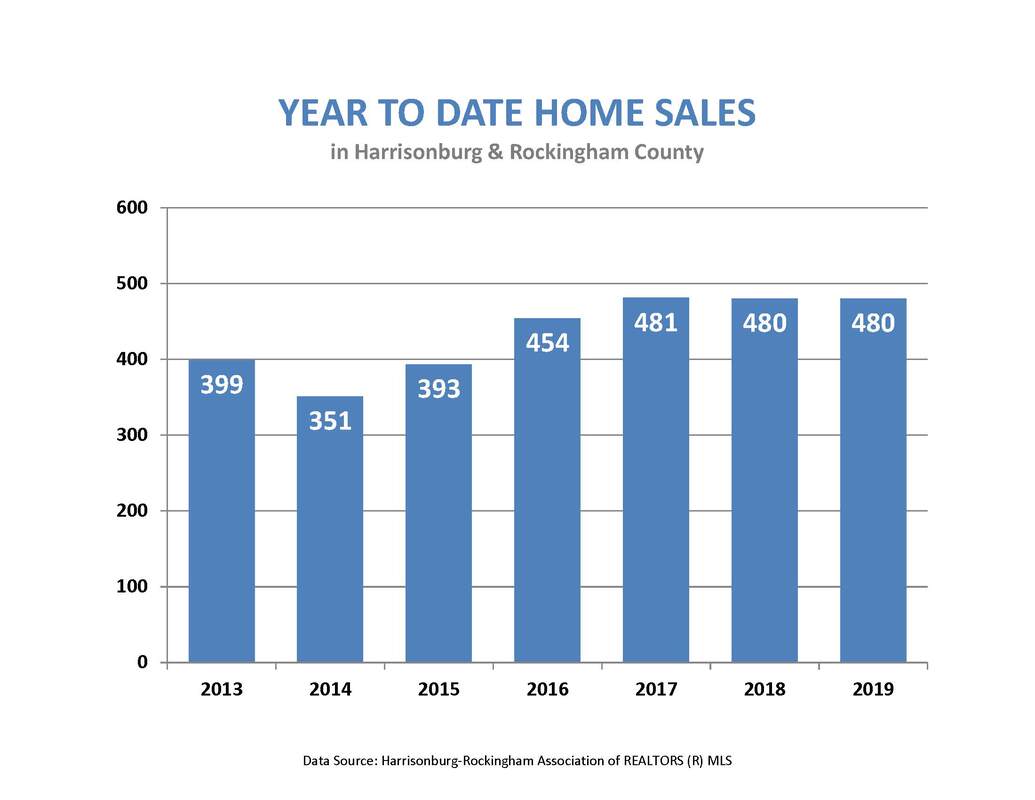
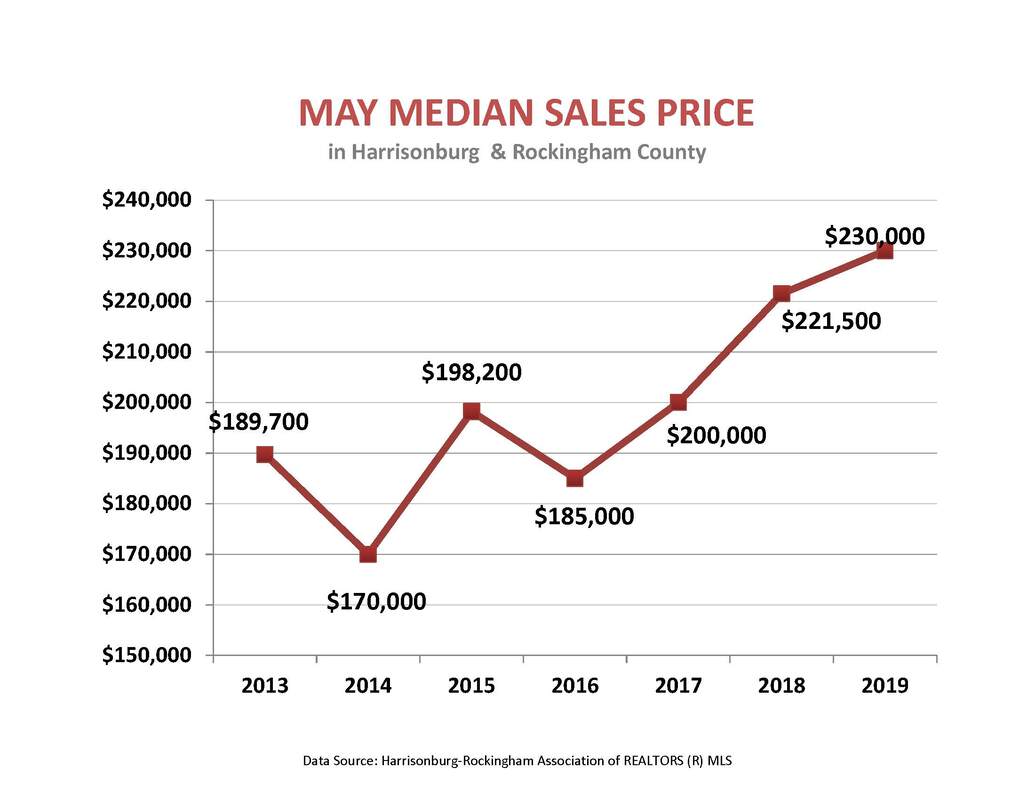
The median sales price of homes increased approximately 5% throughout the state, rising to 309,900. This is an estimated increase of 15,000. As in the valley, the state’s median price has risen largely due to the low number of active listings. Low inventory levels continues to drive the price of homes upwards and the number of days on the market down. The average days of homes on the market statewide is 47 days, 3 days less than a year ago. Fewer homes were listed at the end of May than a year ago. Roughly 55,090 homes were listed statewide, about 5,800 less than last year, representing a reduction of 10 percent. Info obtained from: May 2019 Virginia Realtors Home Sales Report. May continued to show similar trends to previous years. As in 2018, the median days on the market is in the high 20s. This shows that inventory is very low so houses are going under contract quickly. The number of homes sold in May was strong, with 2017 being the only other year in recent years to have surpassed 2019. Year to date home sales is comparable to previous years showing that the market is not slowing even though the number of homes for sale is lower than any of the previous years at 277. So while there may not be as many houses on the market, homes are still being sold and they are being sold quickly. May was an excellent month for sellers.
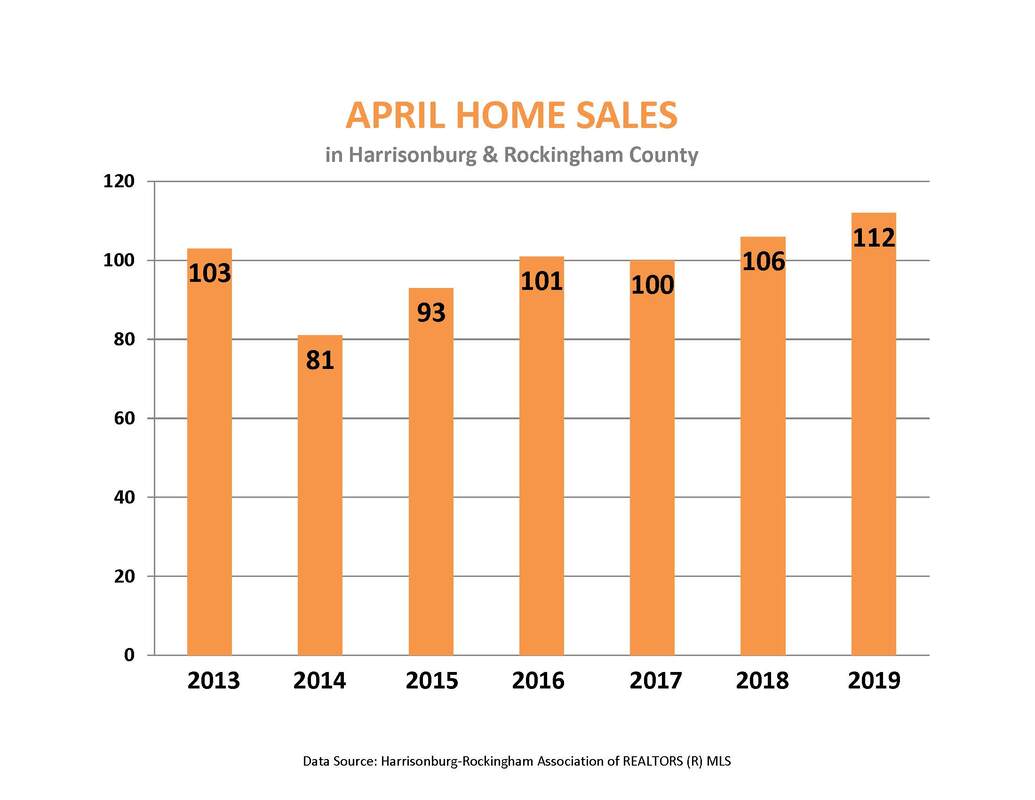
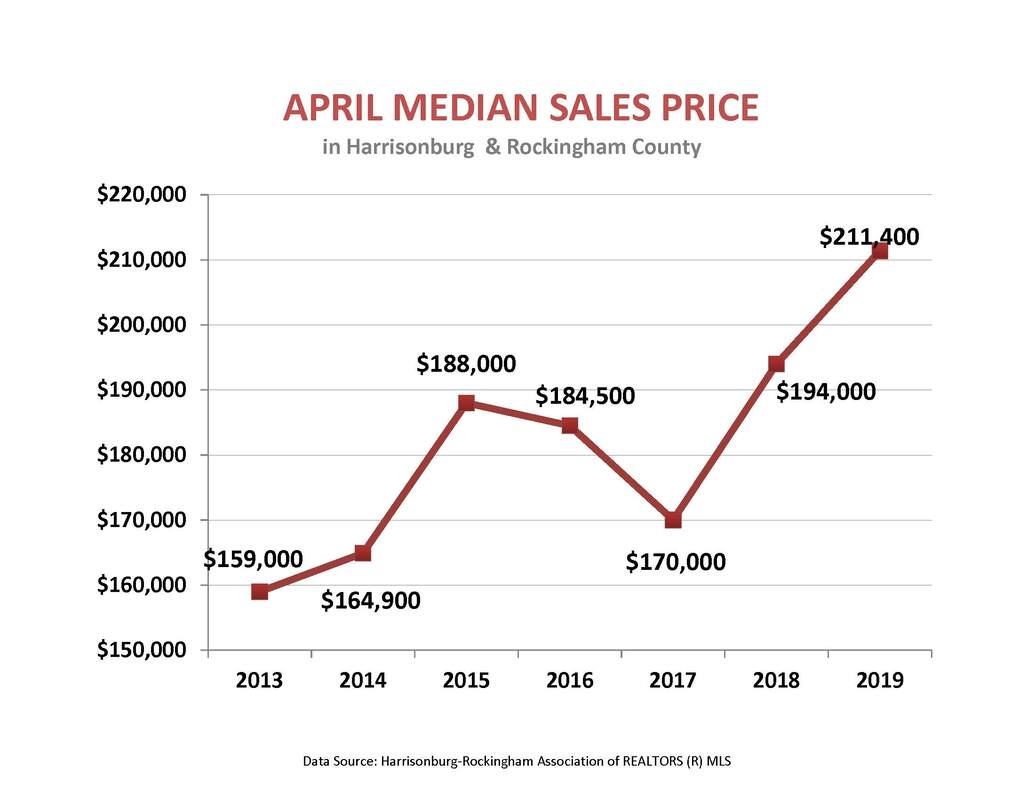
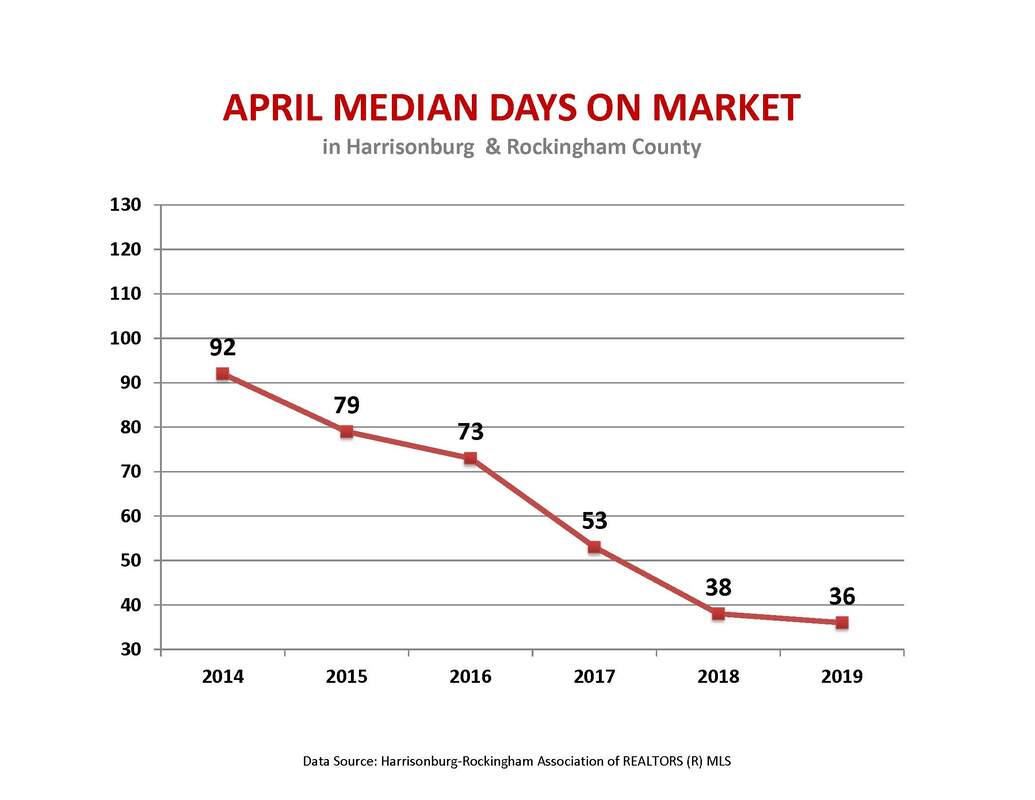
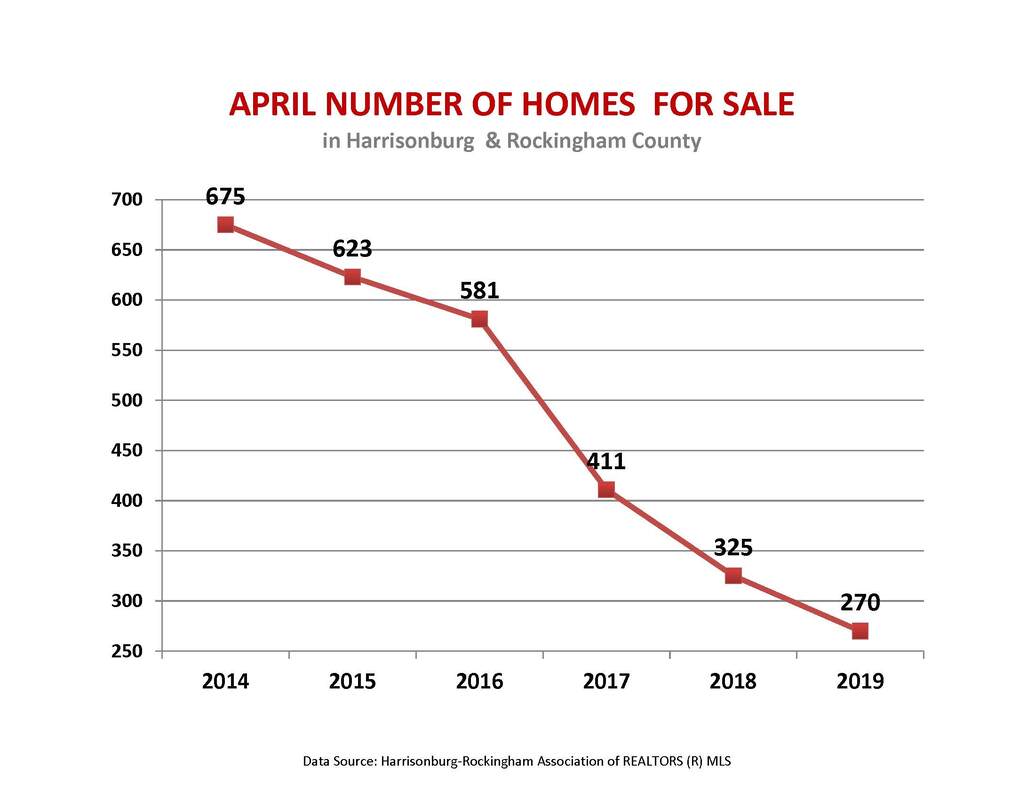
Hello Spring market! In April, we saw an increase in sales, an increase of the median sales price, less days on the market, and we still don't have enough homes to sell!
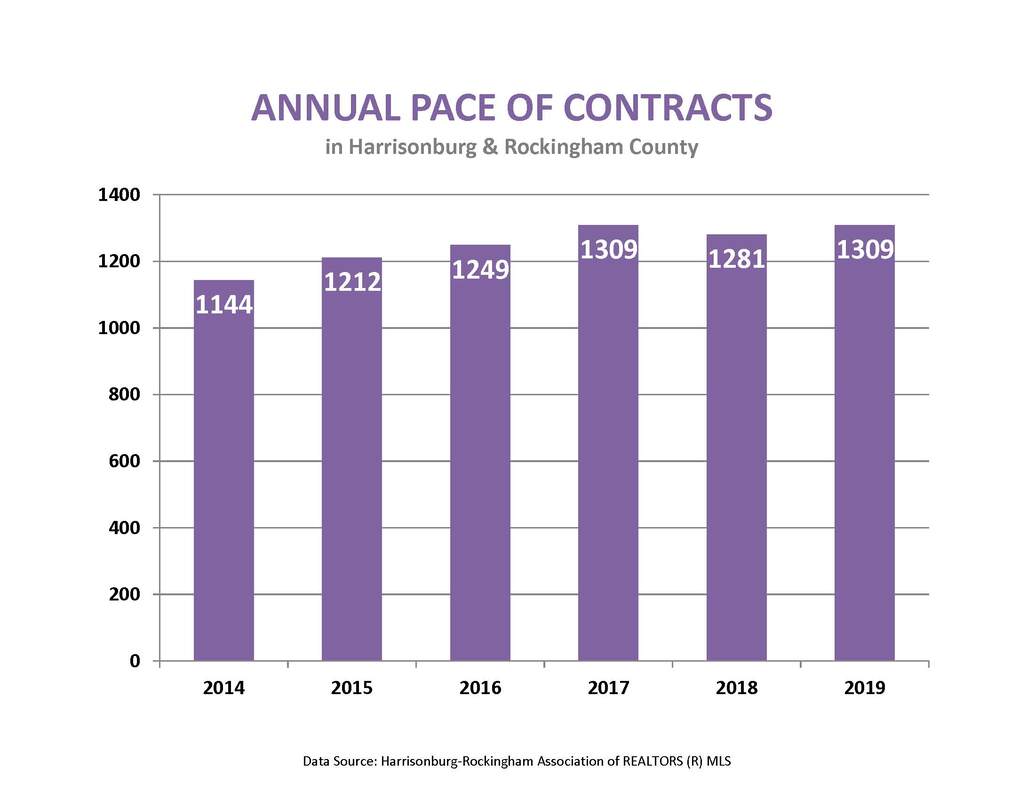
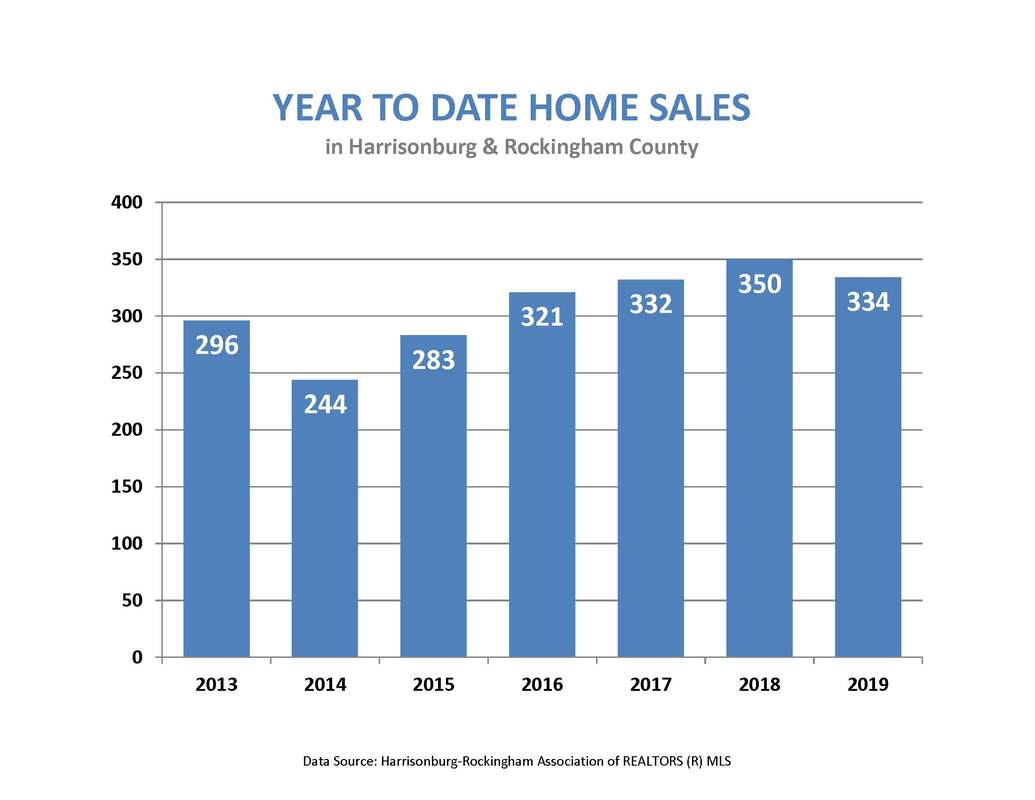
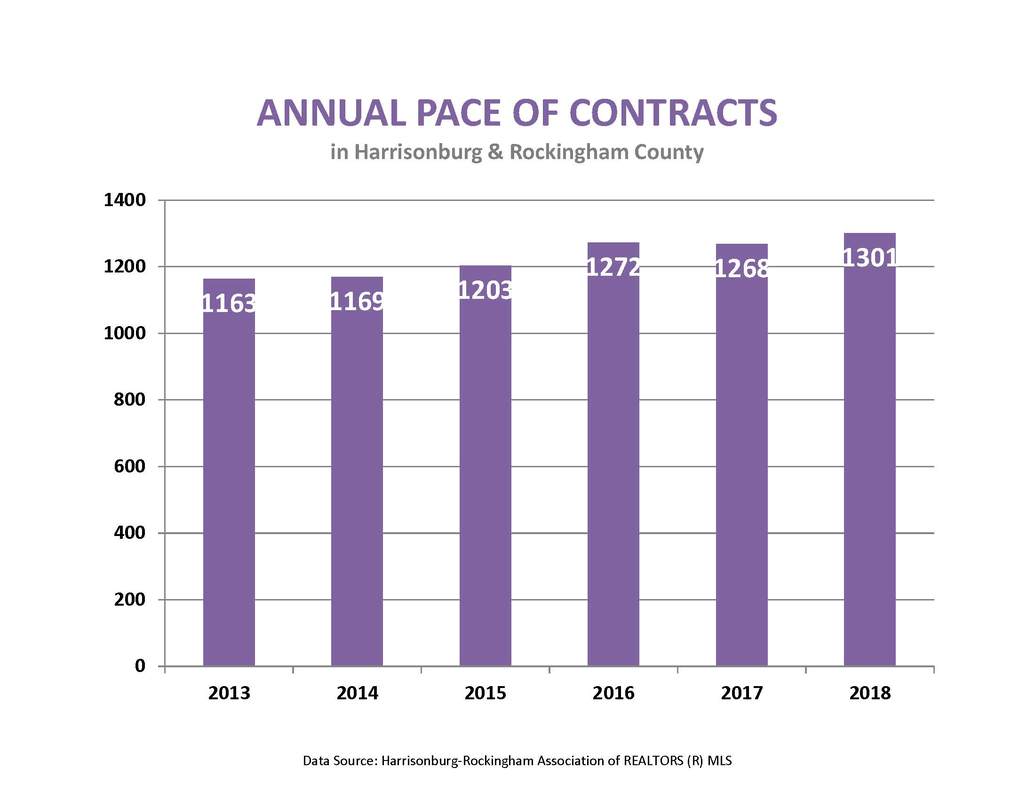
If I were going to highlight one statistic, I would highlight the number of contracts we had in April. Not all of these will become sales but this could be an indication that the sales in May and June will be higher than previous years. This could also indicate that we will catch up with the year to date sales of last year. To some this may seem redundant at this point but I have to keep saying it, if you are thinking of selling your home, now is an excellent time. For more information on selling your home, click here. The statics are still indicating a slower start to the year. We don't have as many sales but contracts are on the rise. The lack of inventory is still likely the main contributor to the median sales price being higher and the median days on the market being lower than last year.
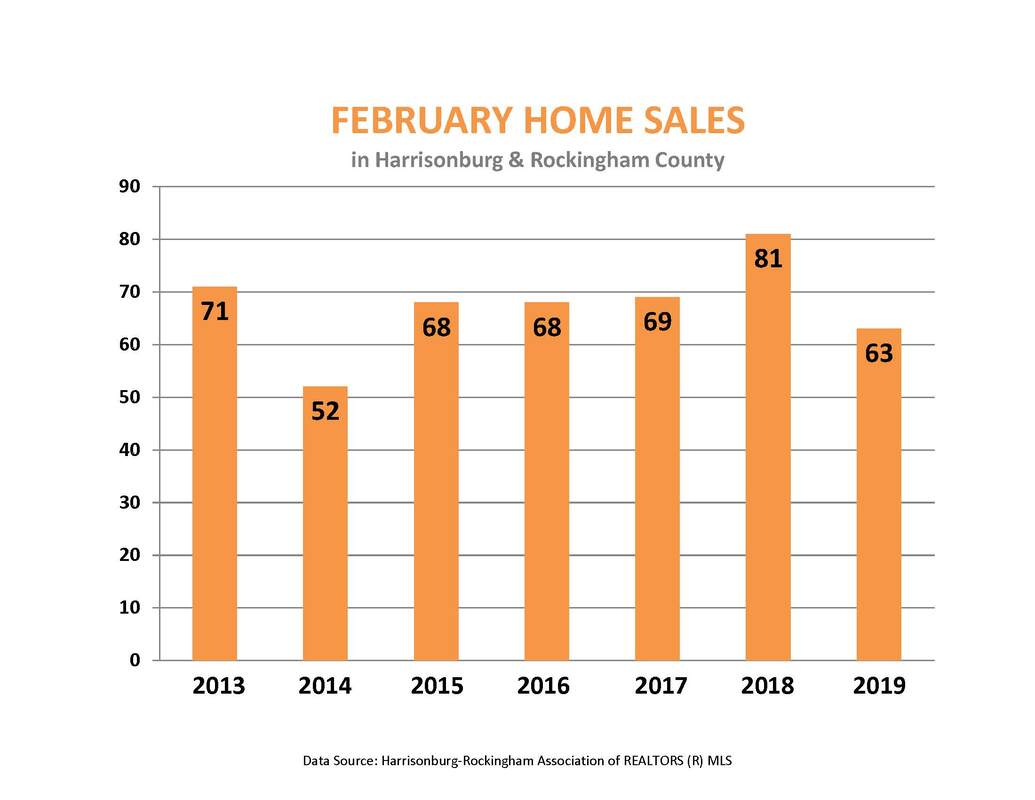
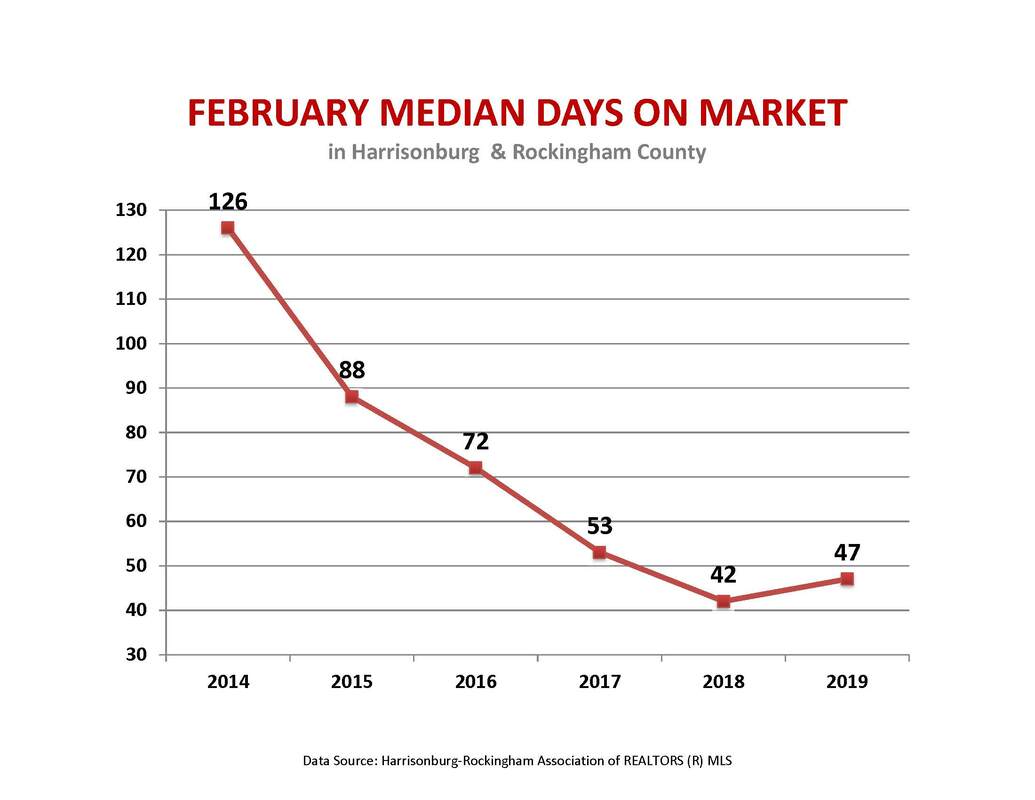
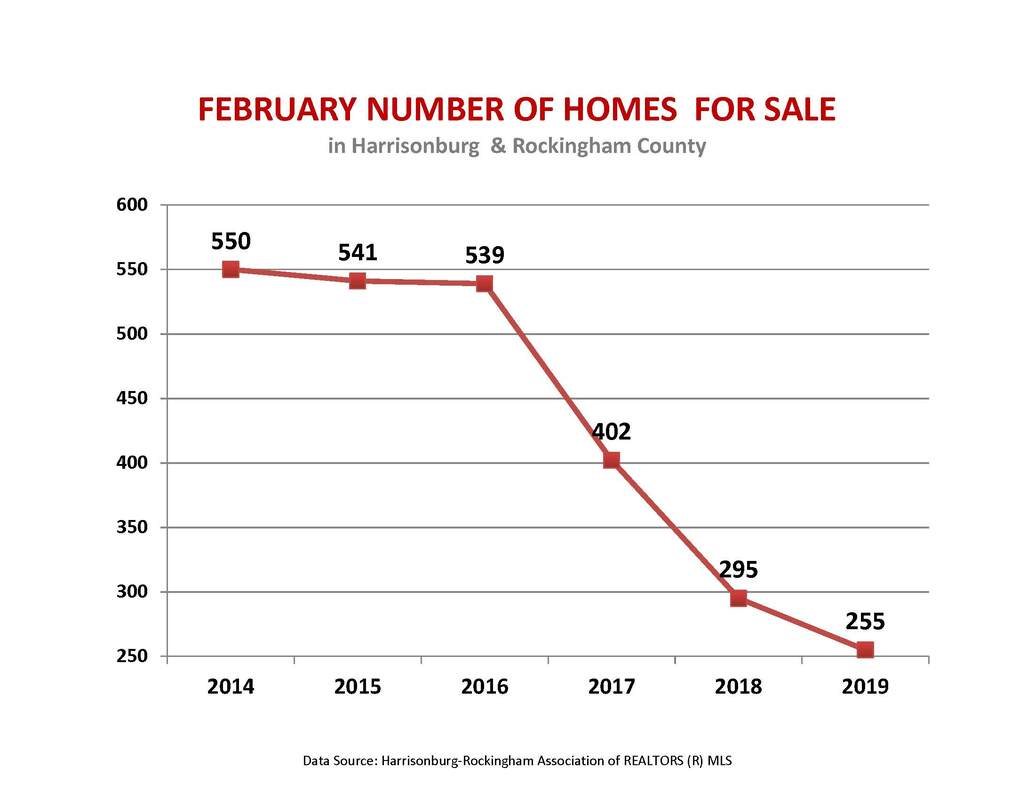
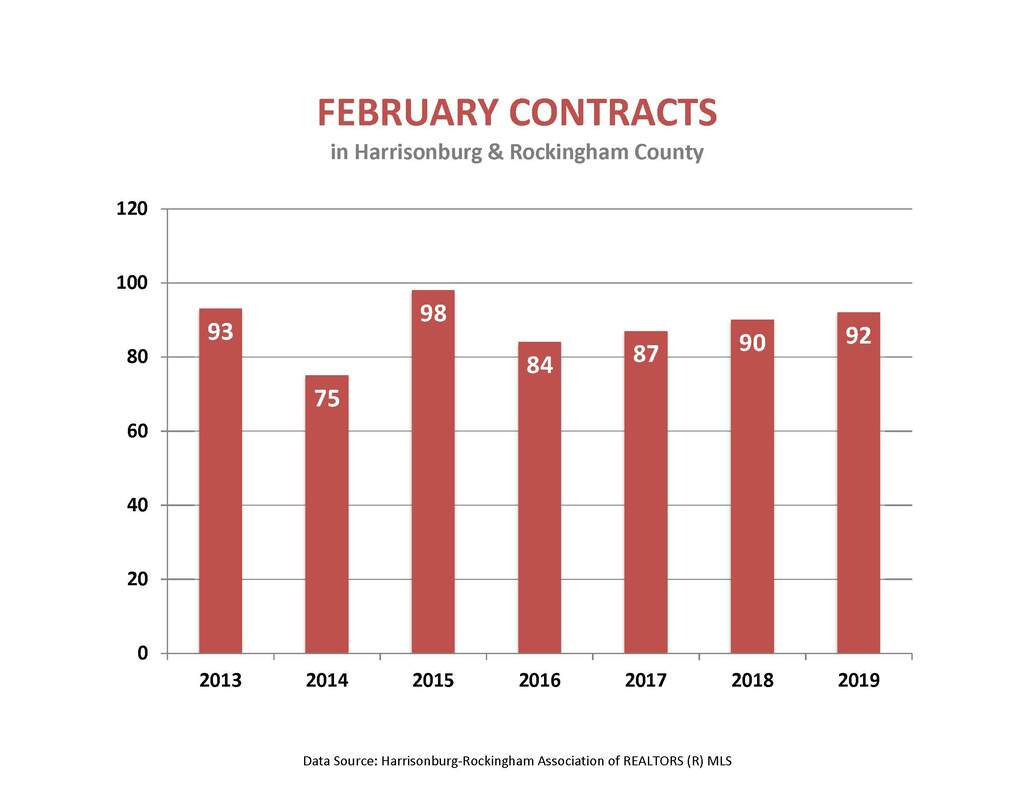
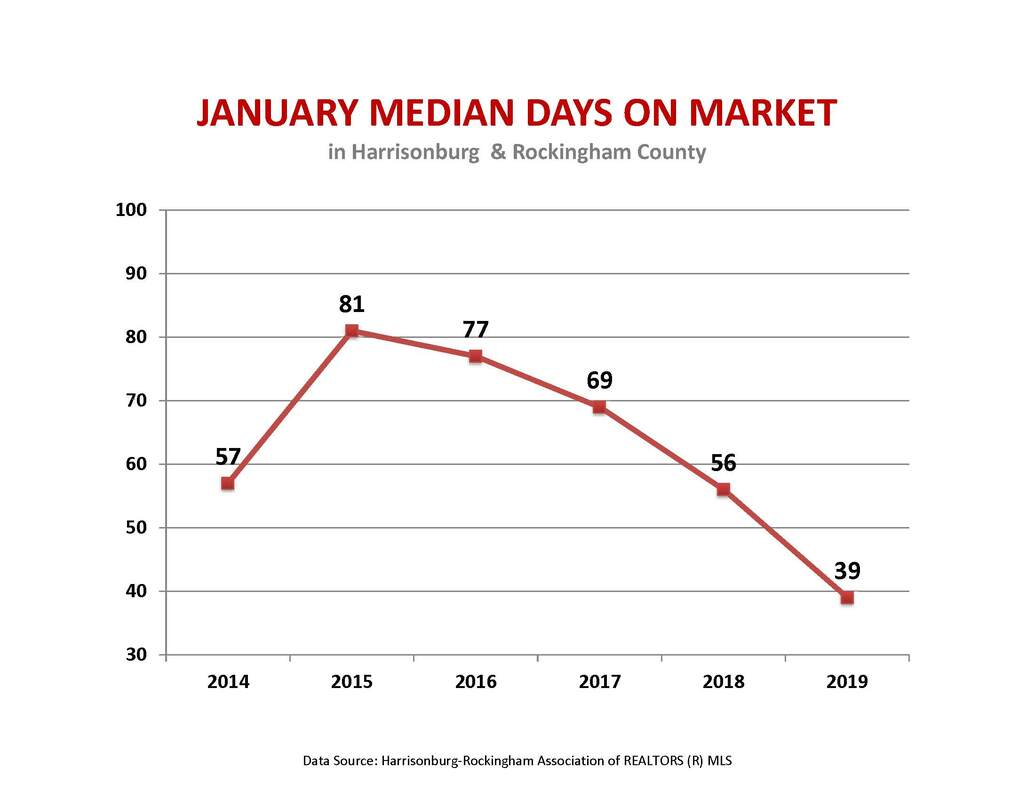
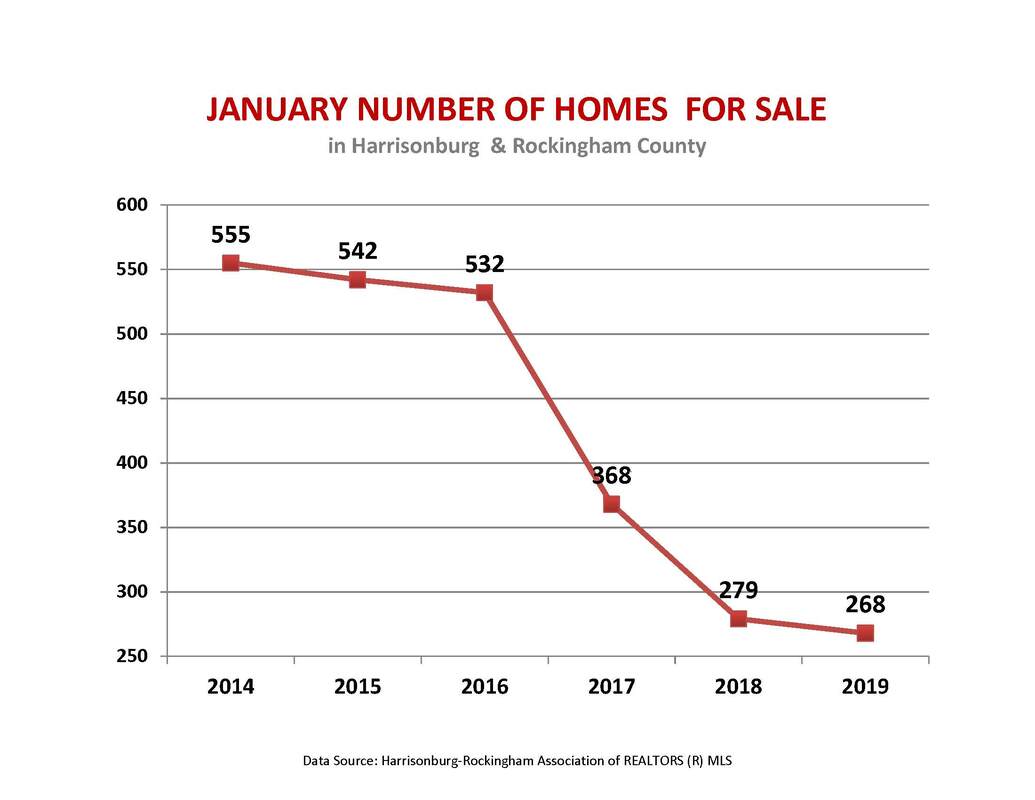
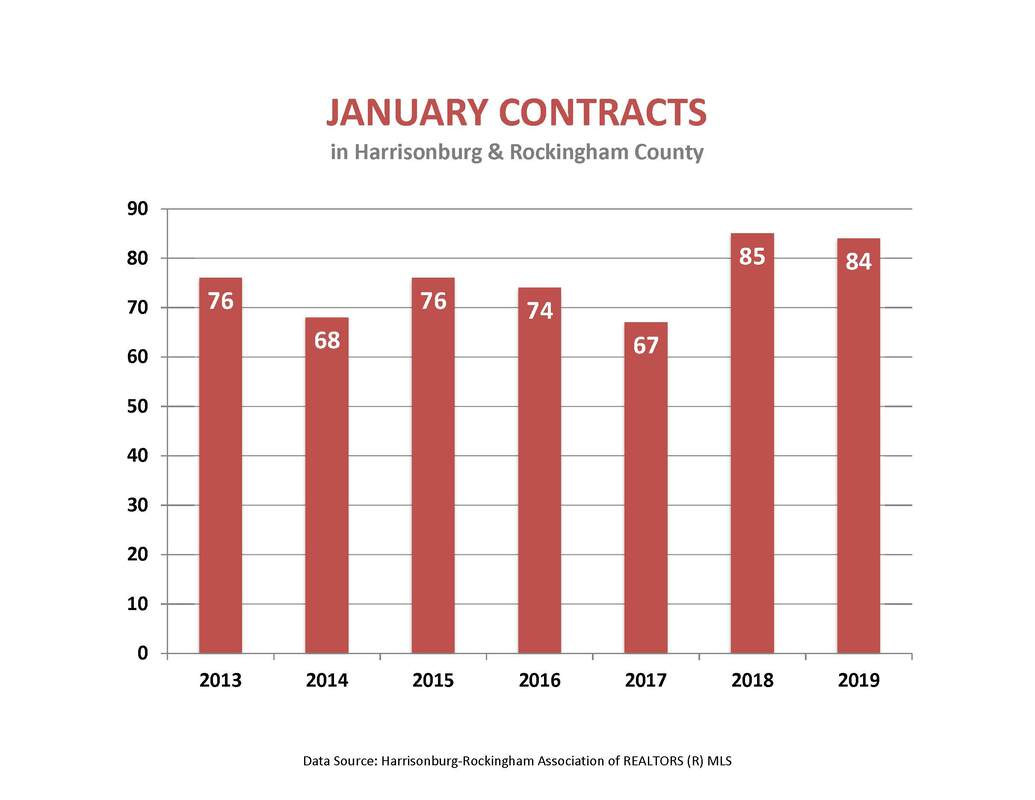
If you are considering selling your home, it is a good time! If you want to buy a home, lets discuss strategies for finding a home in a competitive market. Last month, we discussed the market having slowed slightly. Has the trend continued into February? As always, the answer isn't black and white.
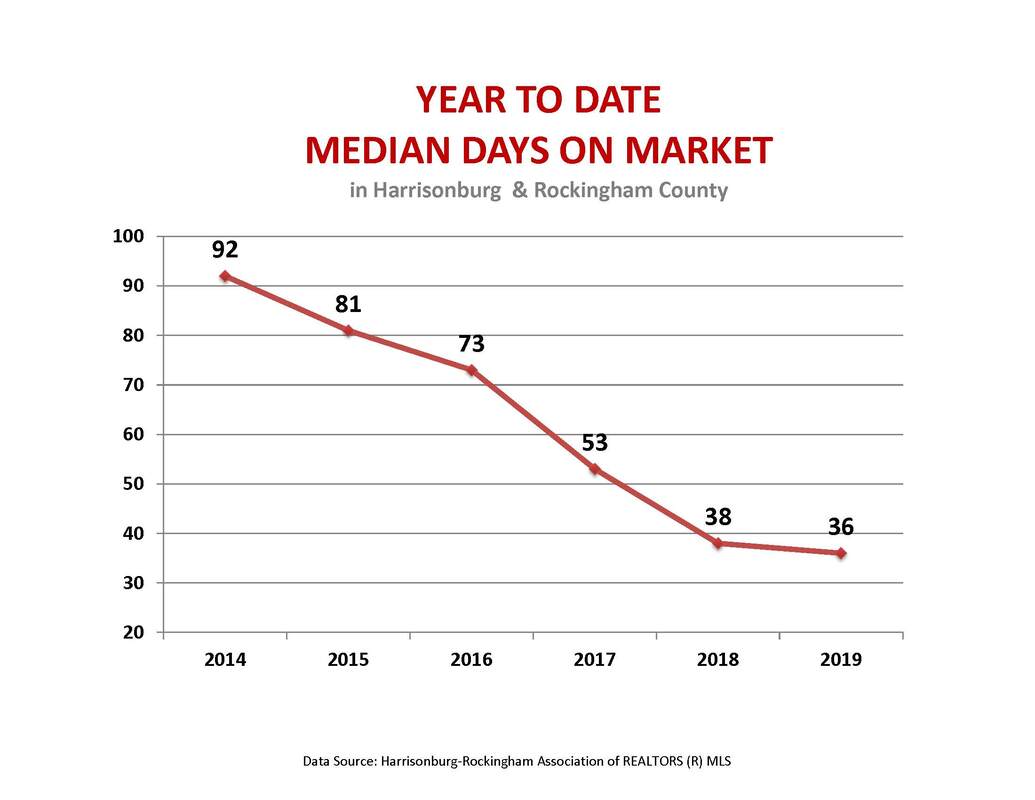
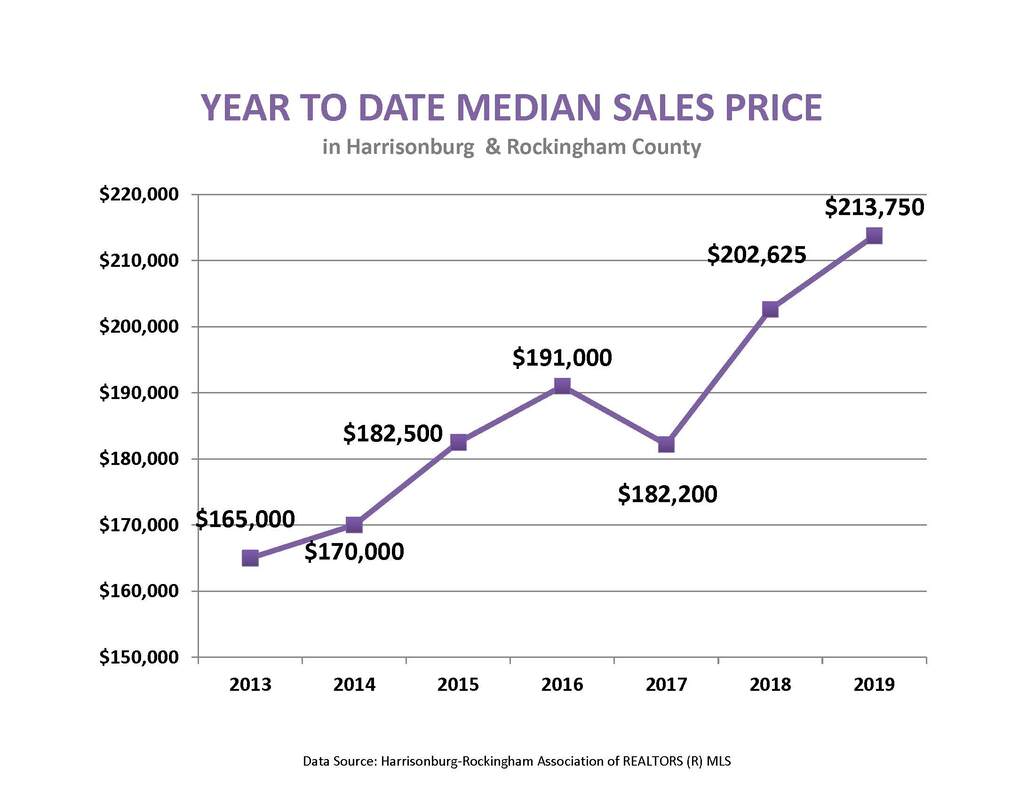
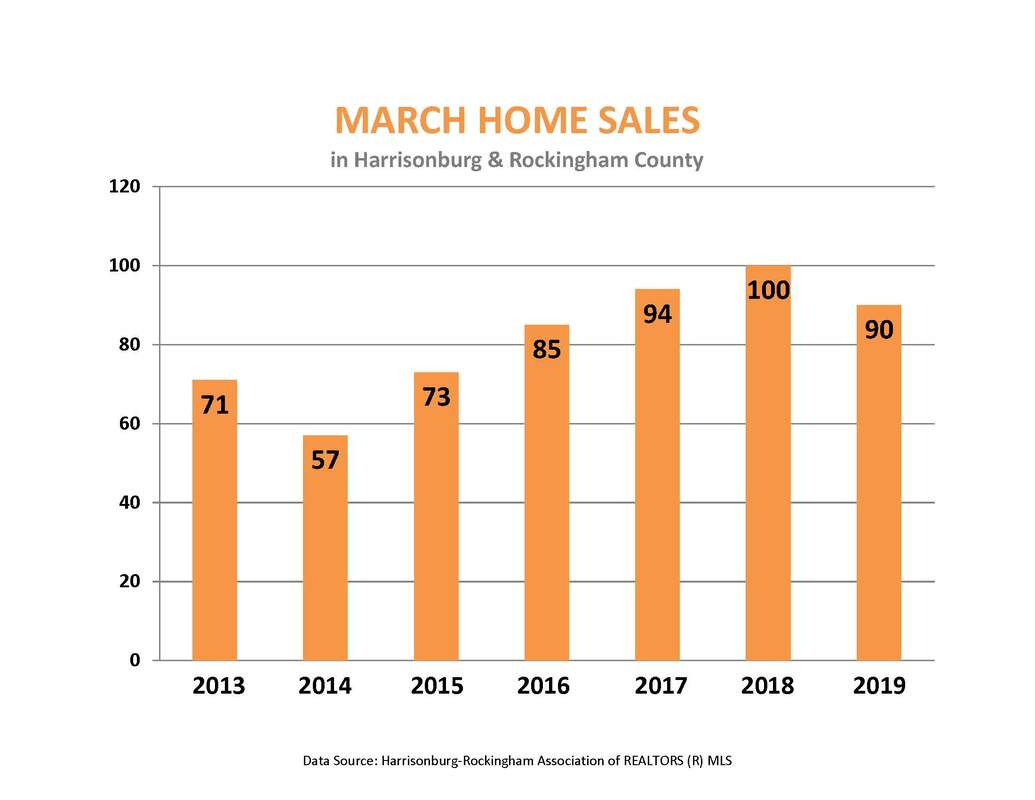
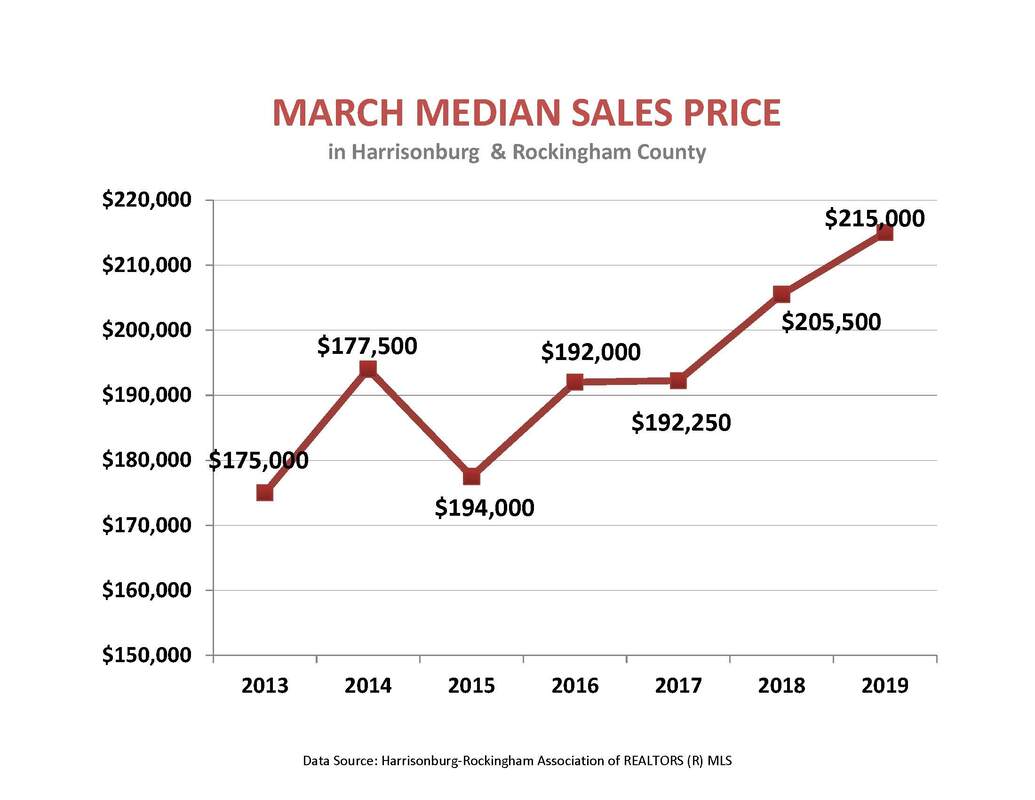
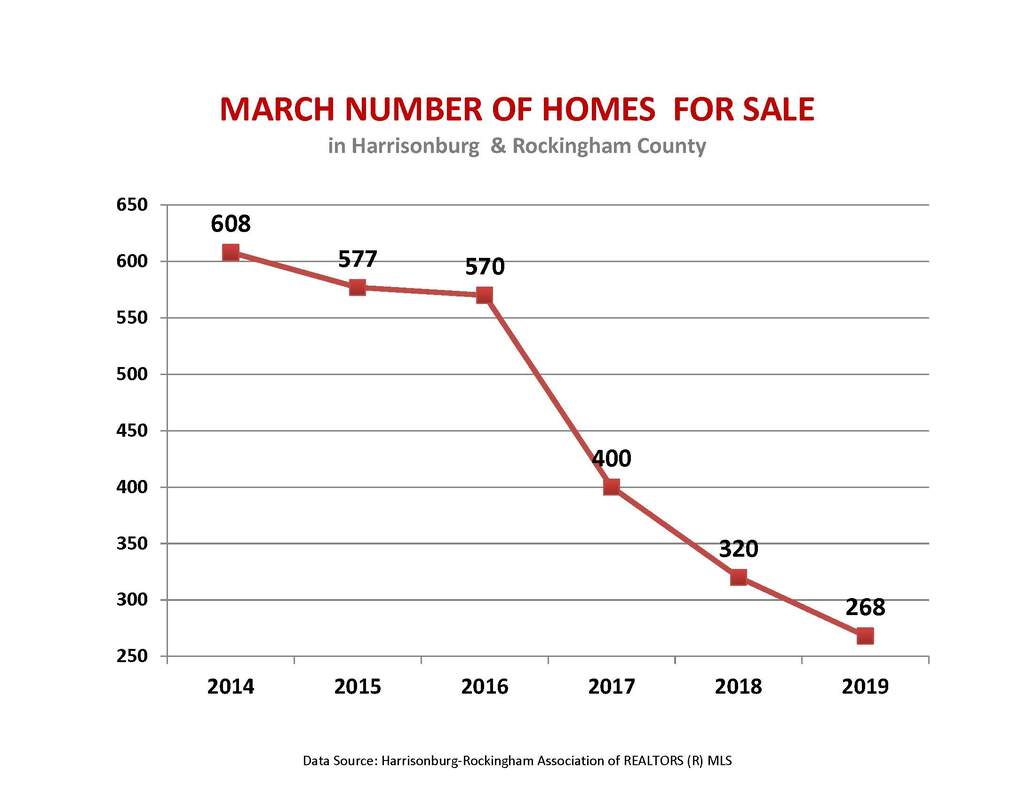
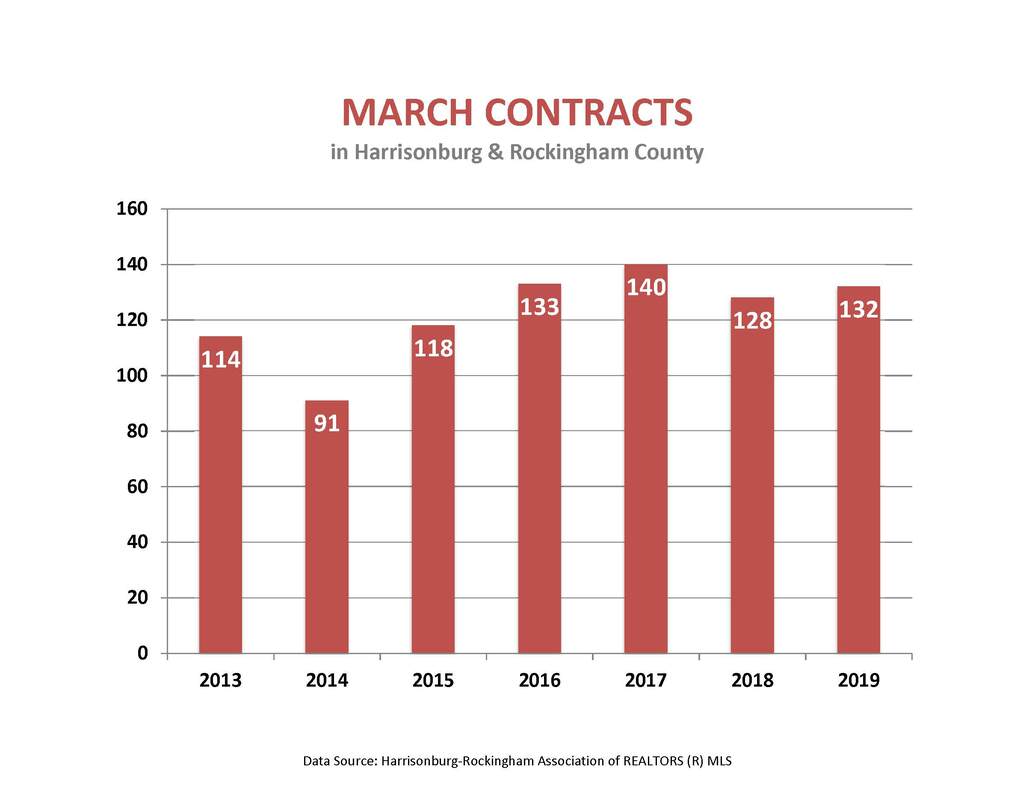
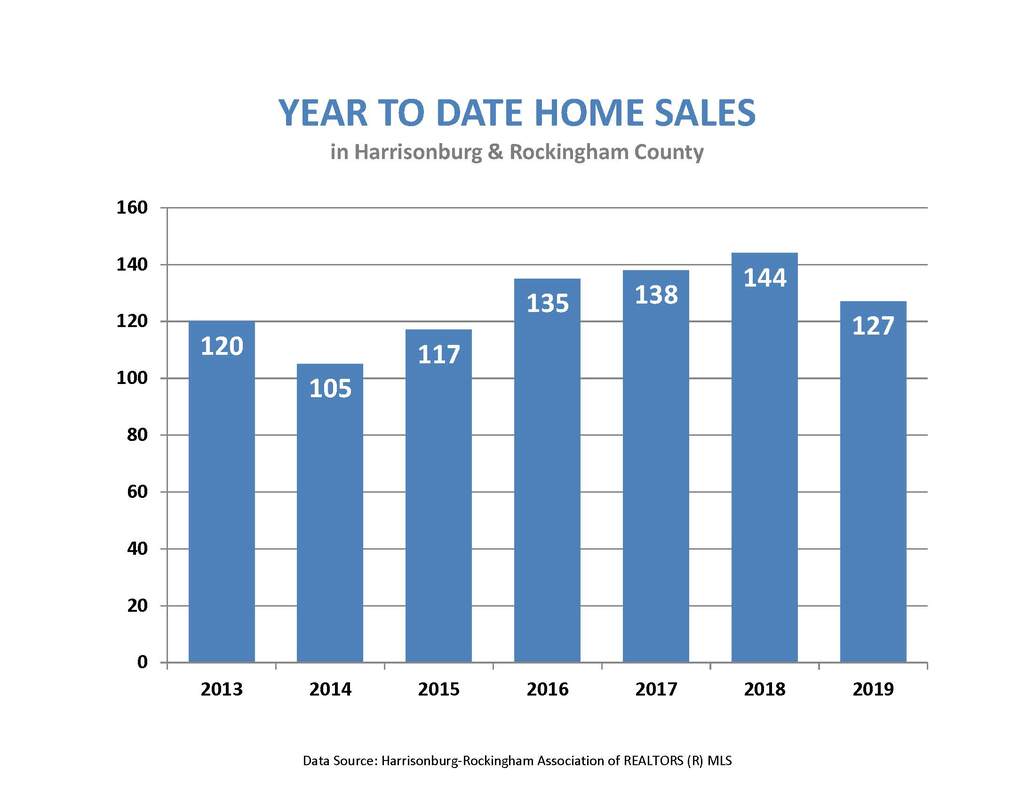
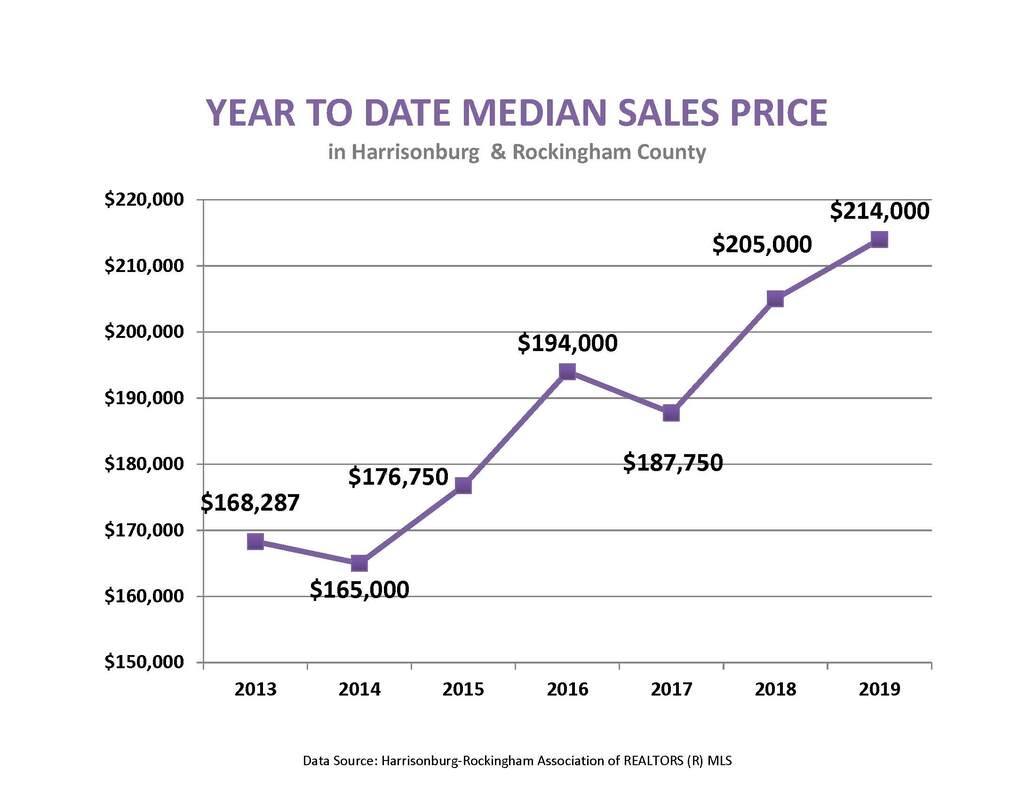
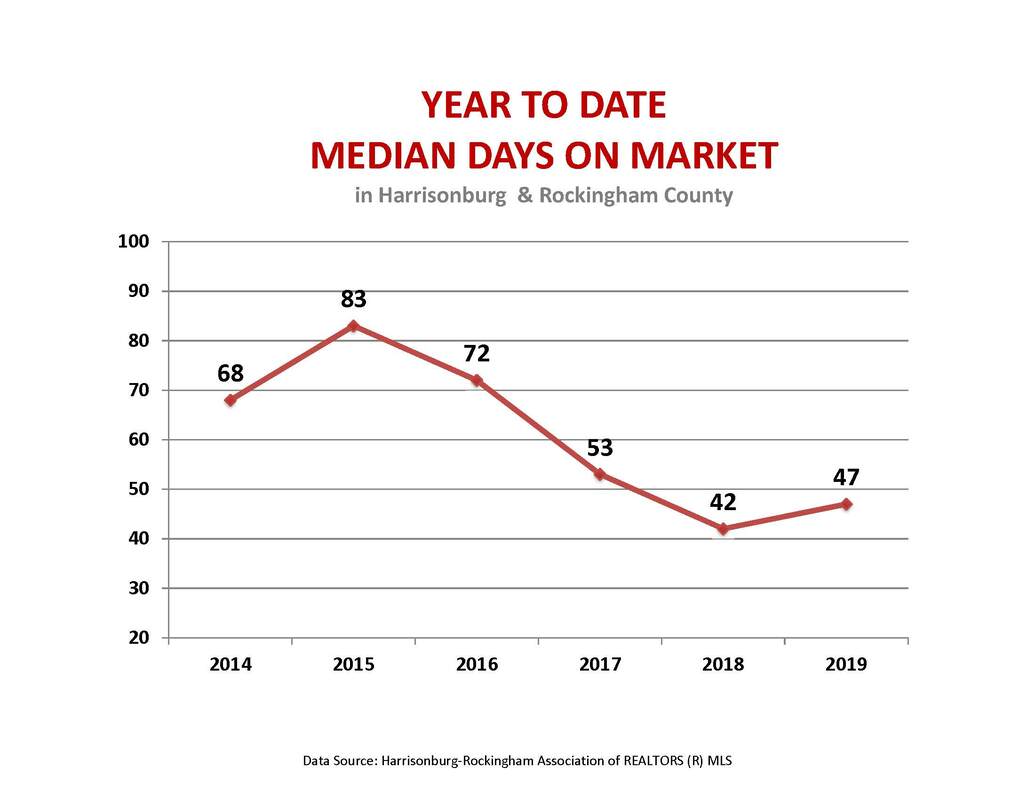
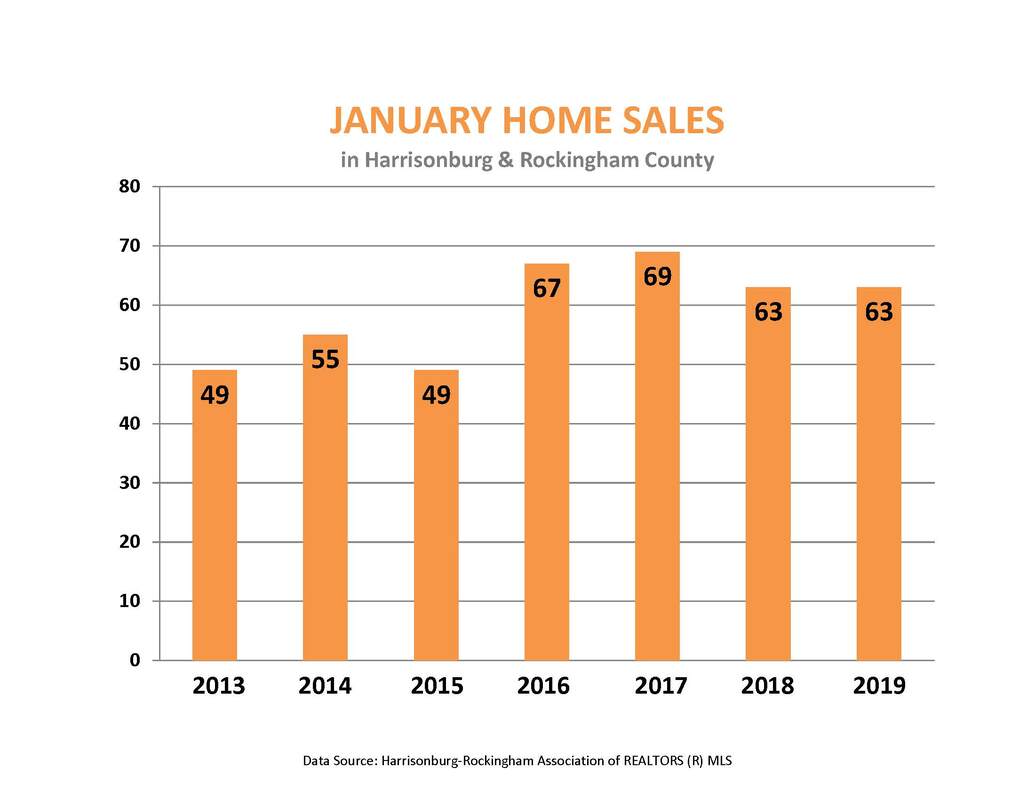
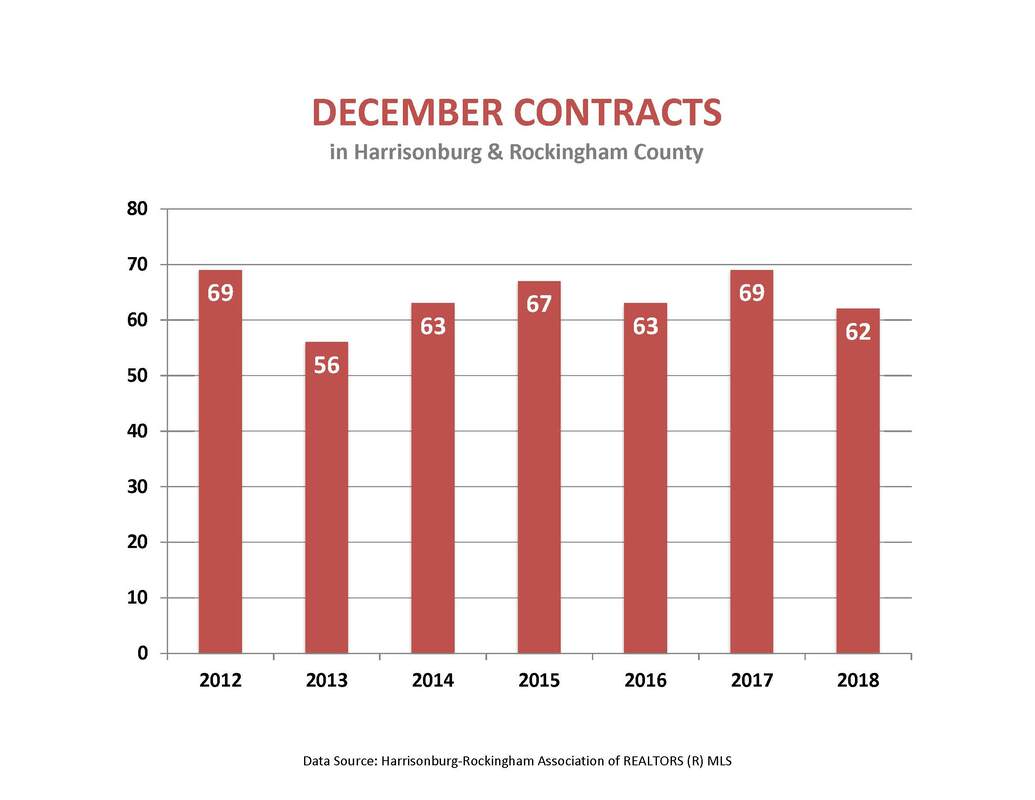
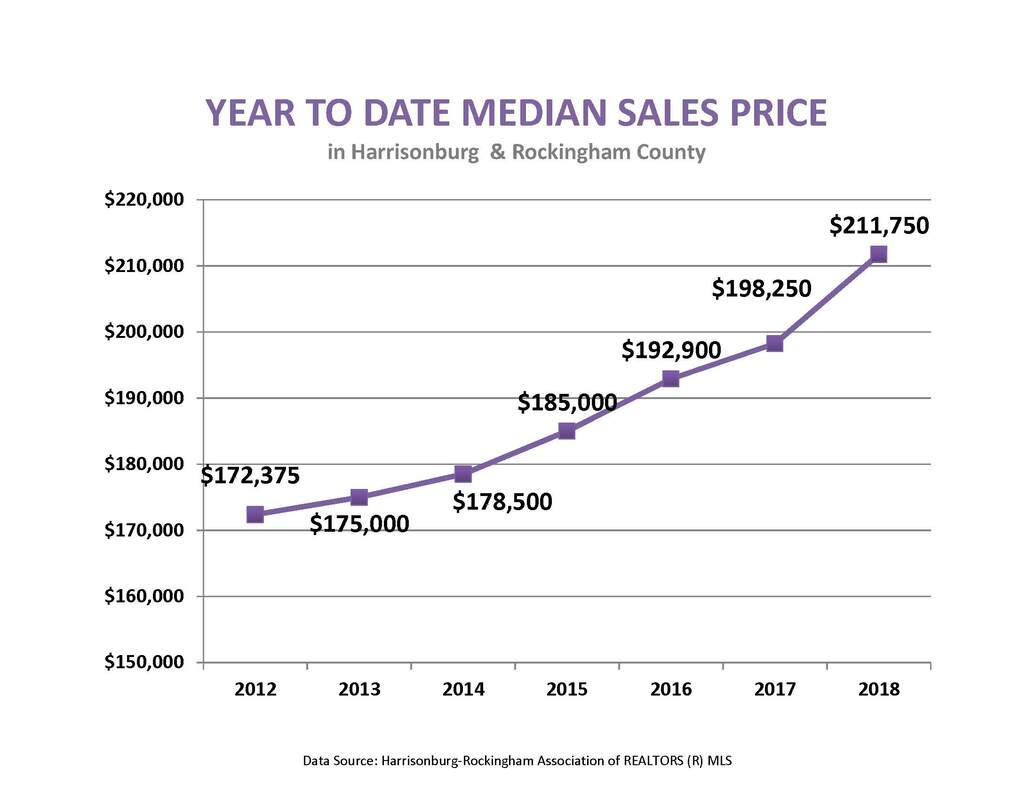
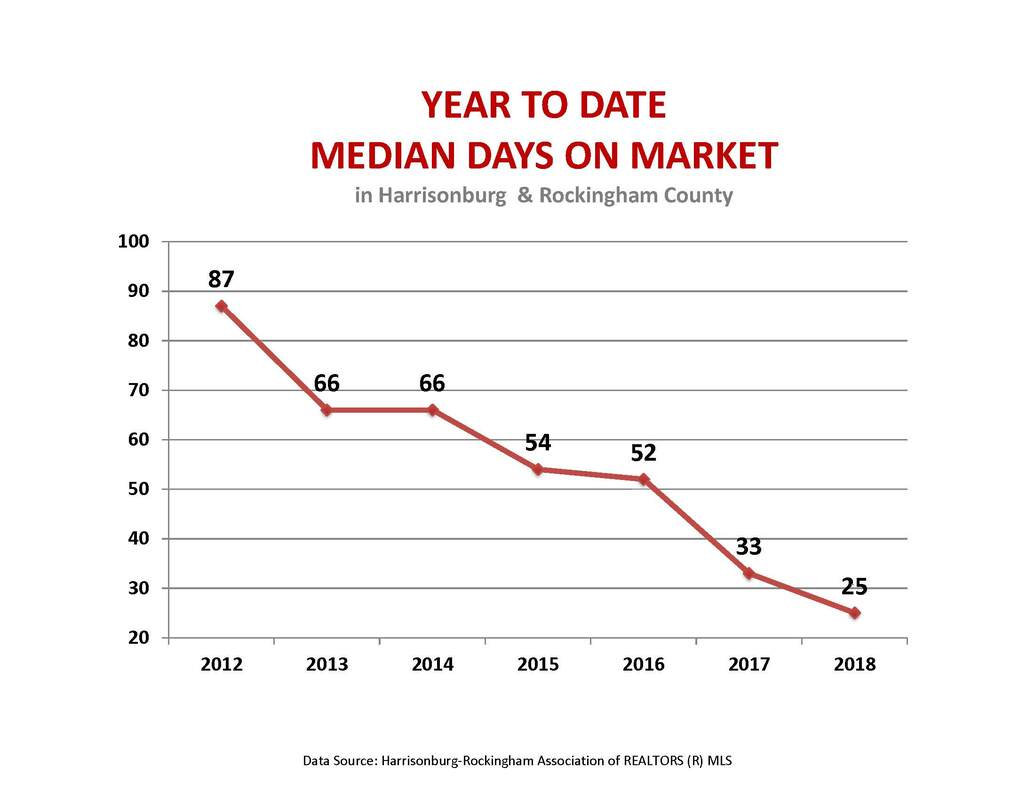
If you look at the number of sales in February 2019 and February 2018, it may be easy to conclude that the market is not doing as well. However, the number sales in February are a result of the prior months activity which we have already concluded to be lack luster. The median sales price is significantly higher than February of last year. This is likely still mostly due to the lack of inventory. The days on the market has gone up a little and the number of homes for sale continues to be low. However, we had more contracts in February of 2019 than February of 2018. This is a good sign that things are starting to pick up again. We will have to see how March does in comparison to 2018. Overall, sales have slowed down. Is this an indication of the market or of the season? At this point, it's likely too early to tell. While the graphs above do compare 2018 at this time to the current market, the market last year was still pretty strong through the Winter. It should also be noted that there isn't too much change in the statistics. If we can get a higher level of inventory in the Spring, we may see an increase in sales and a decrease in the sales price.
Going through the real estate market in 2018 made me feel like it would be a strong year because there seemed to be a sense of urgency. Buyers often needed to act fast on a house they were considering. The lack of inventory also seemed to make the medium sales price increase.
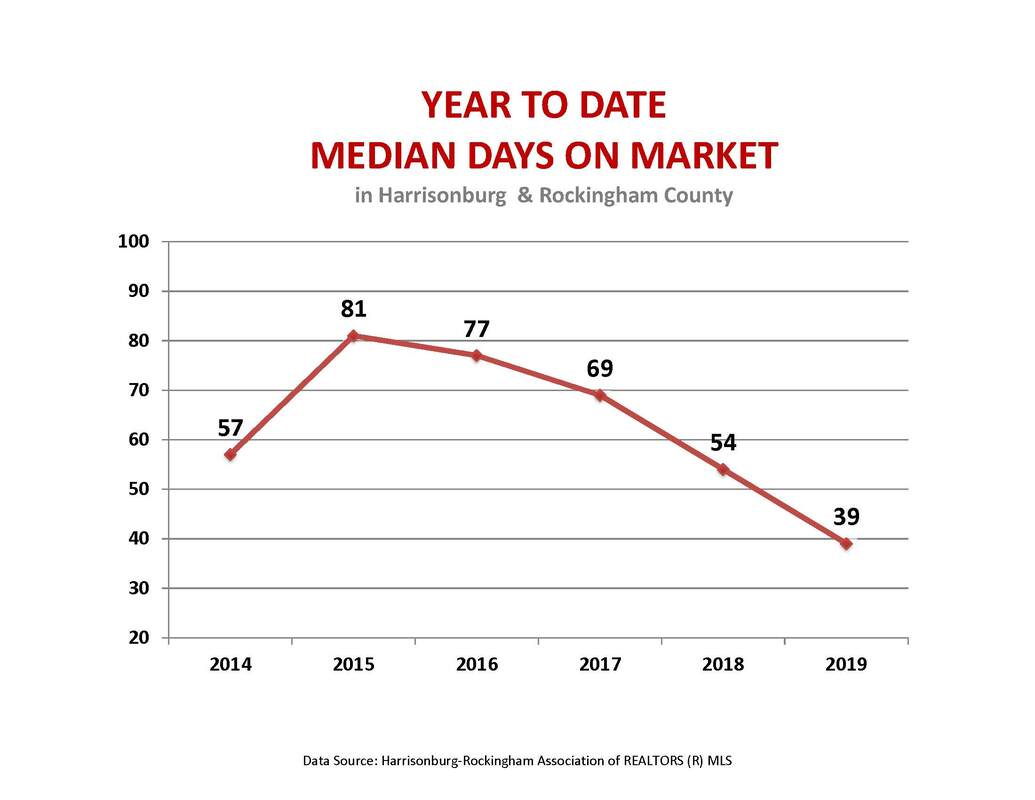
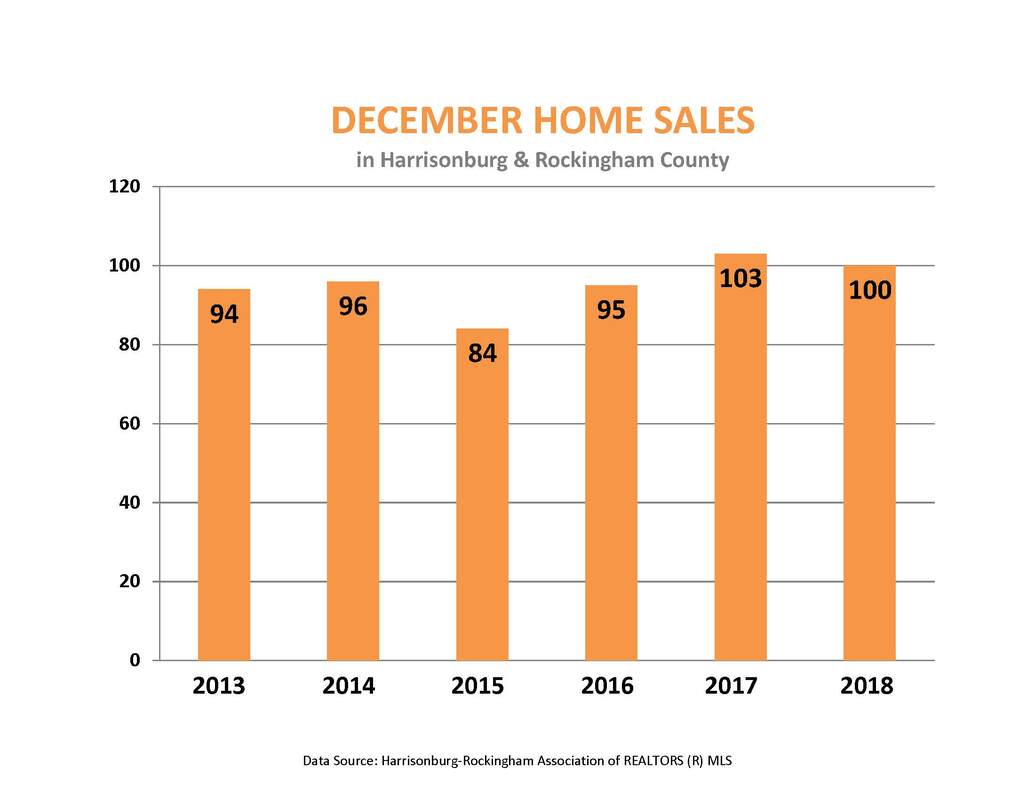
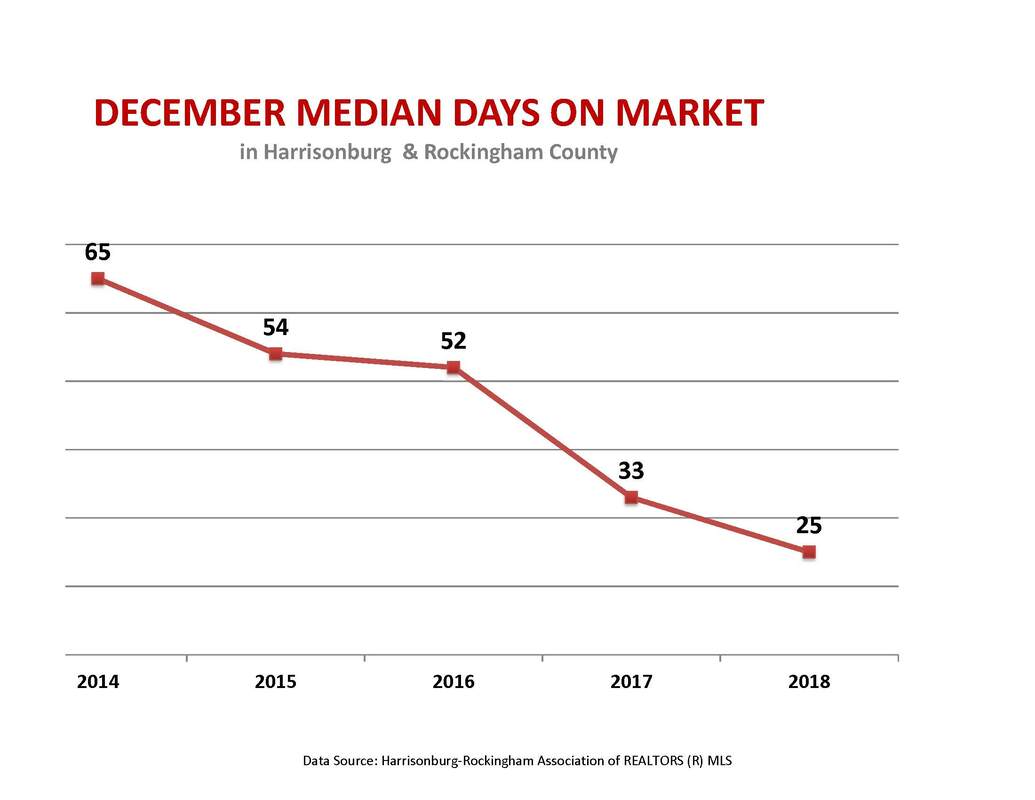
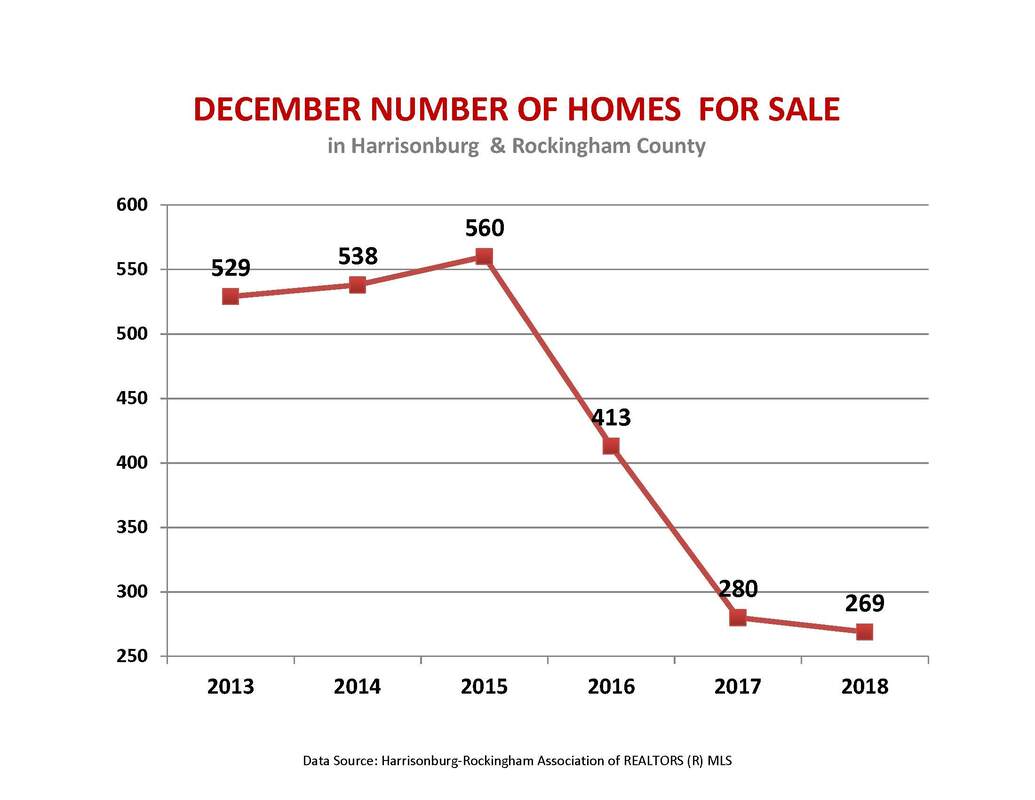
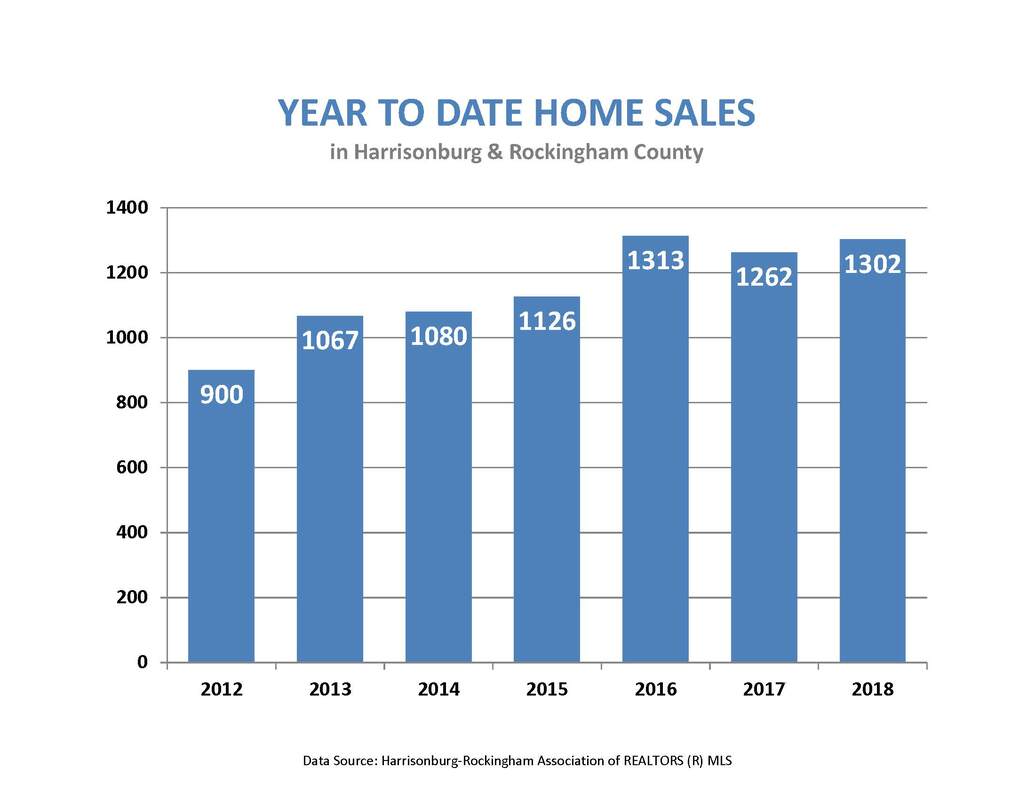
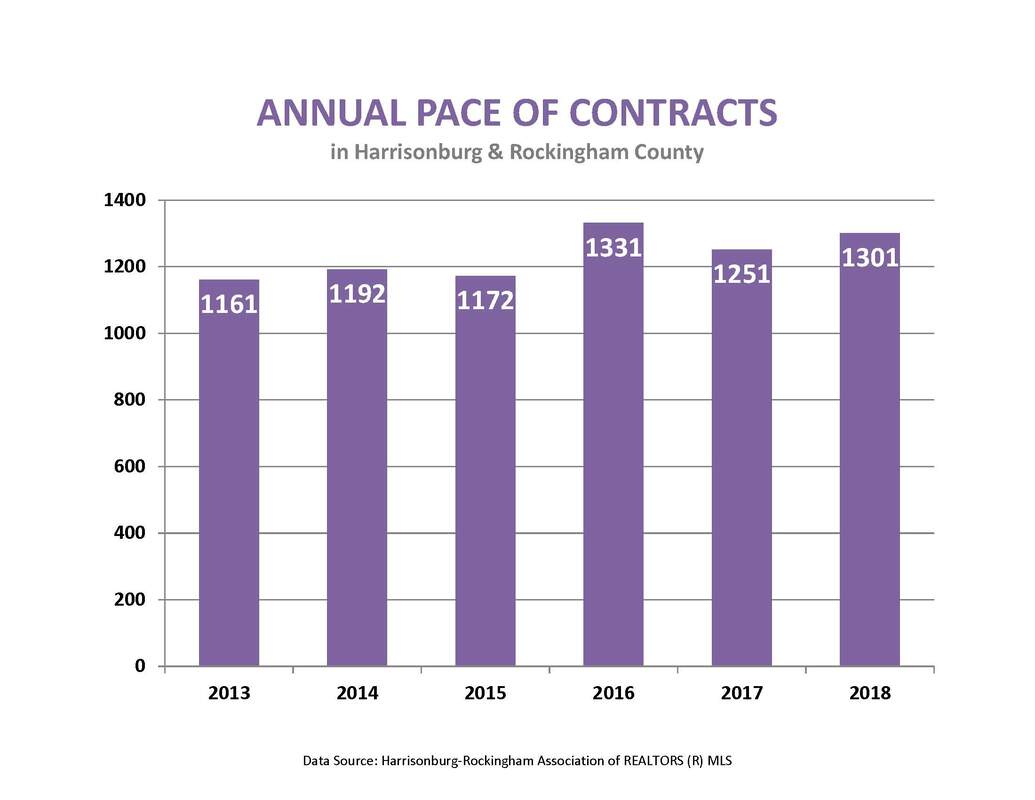
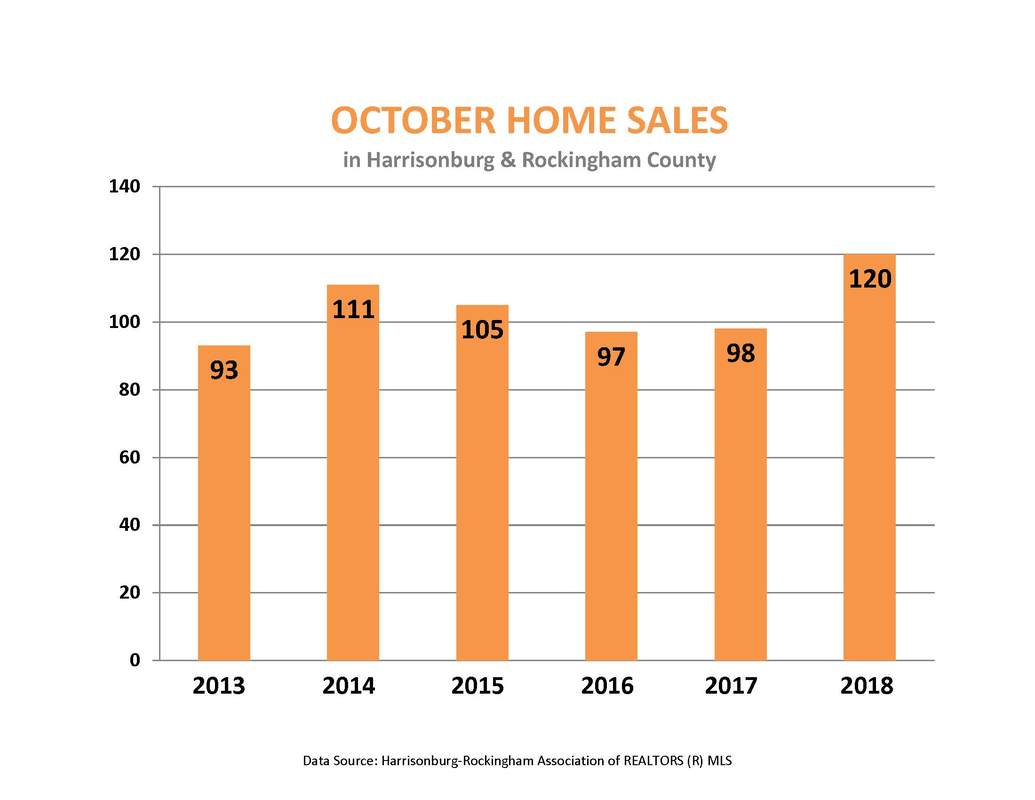
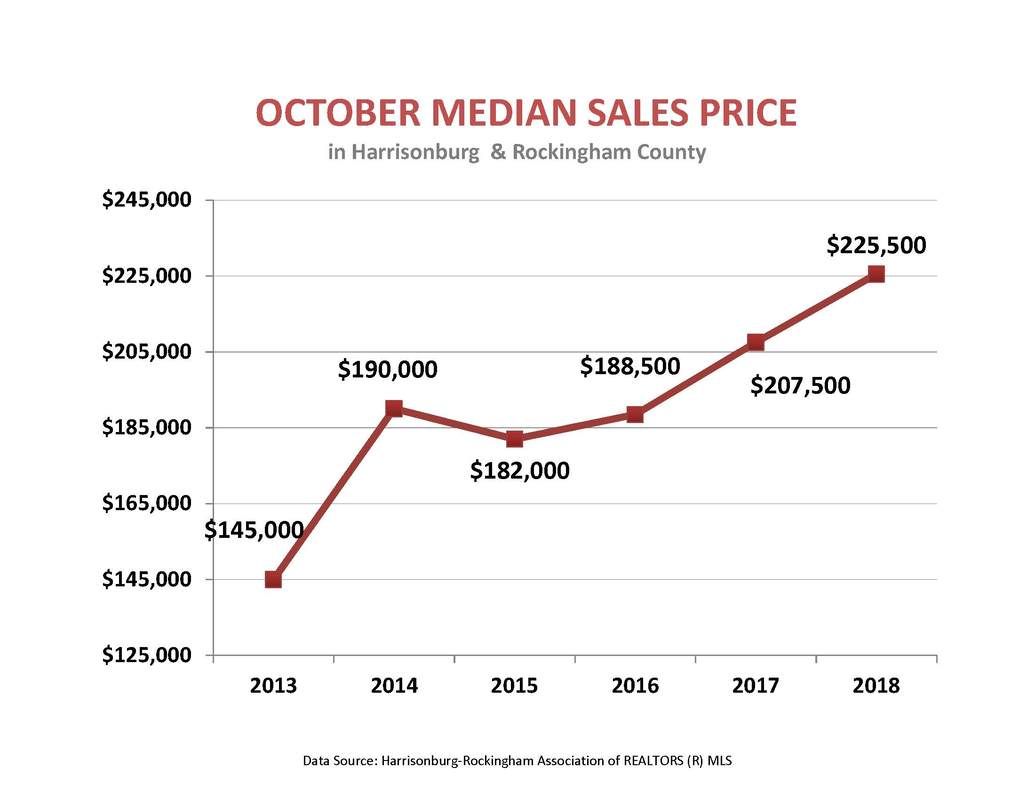
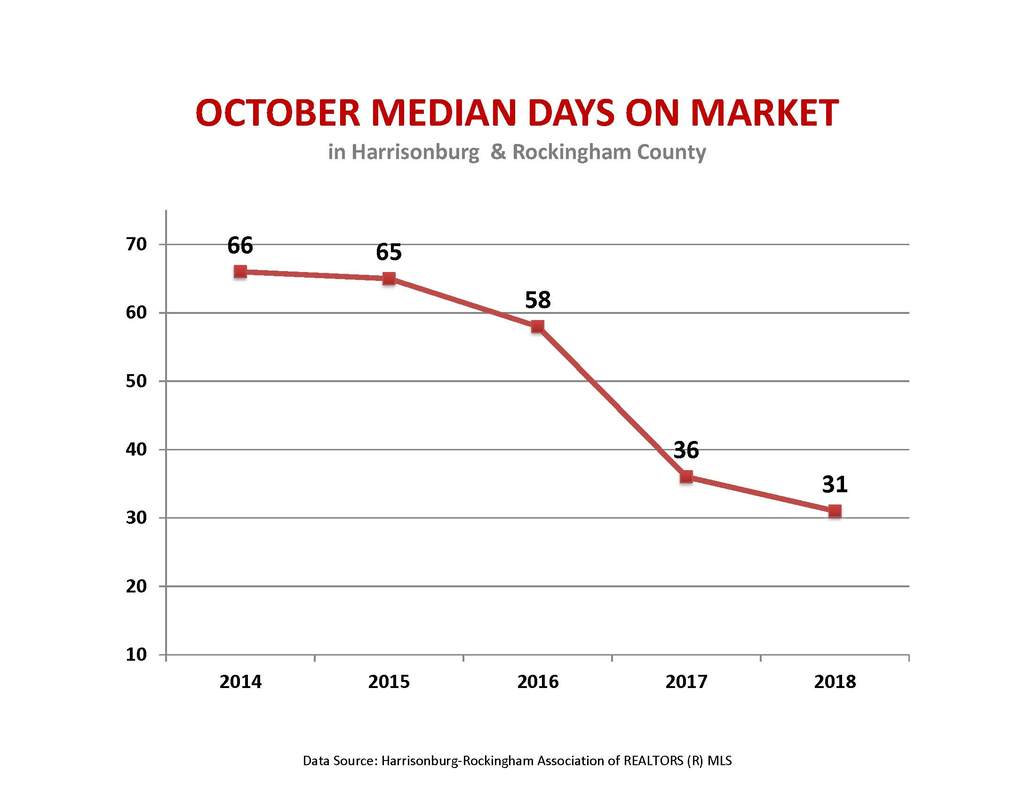
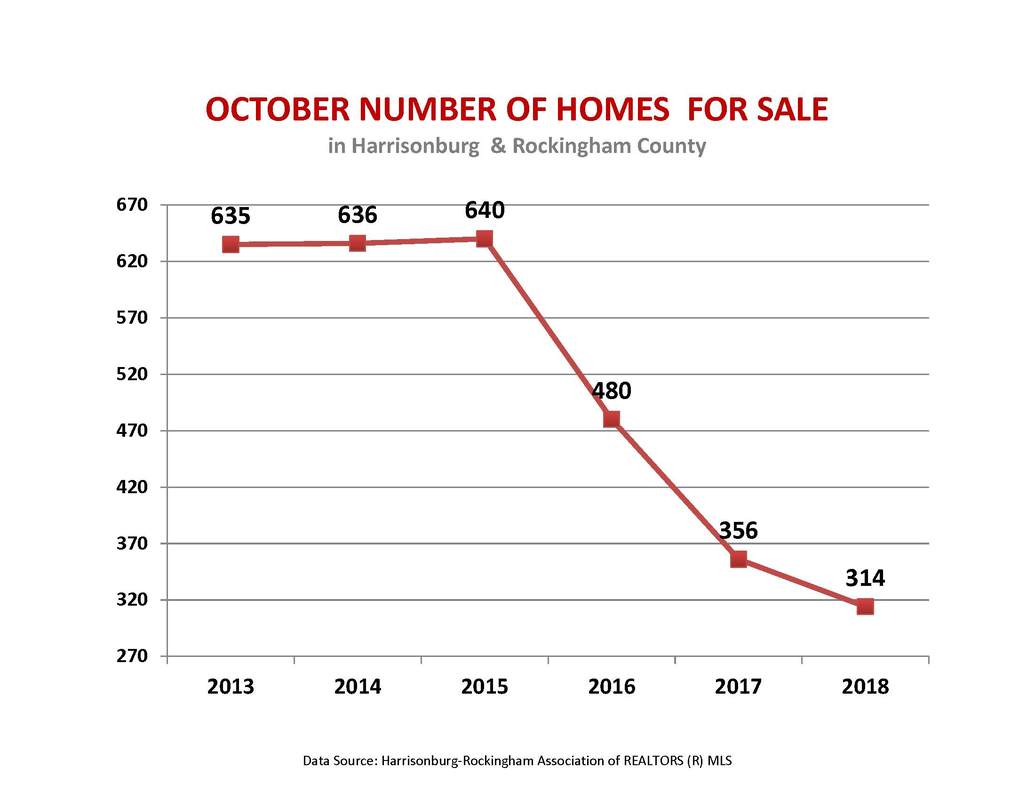
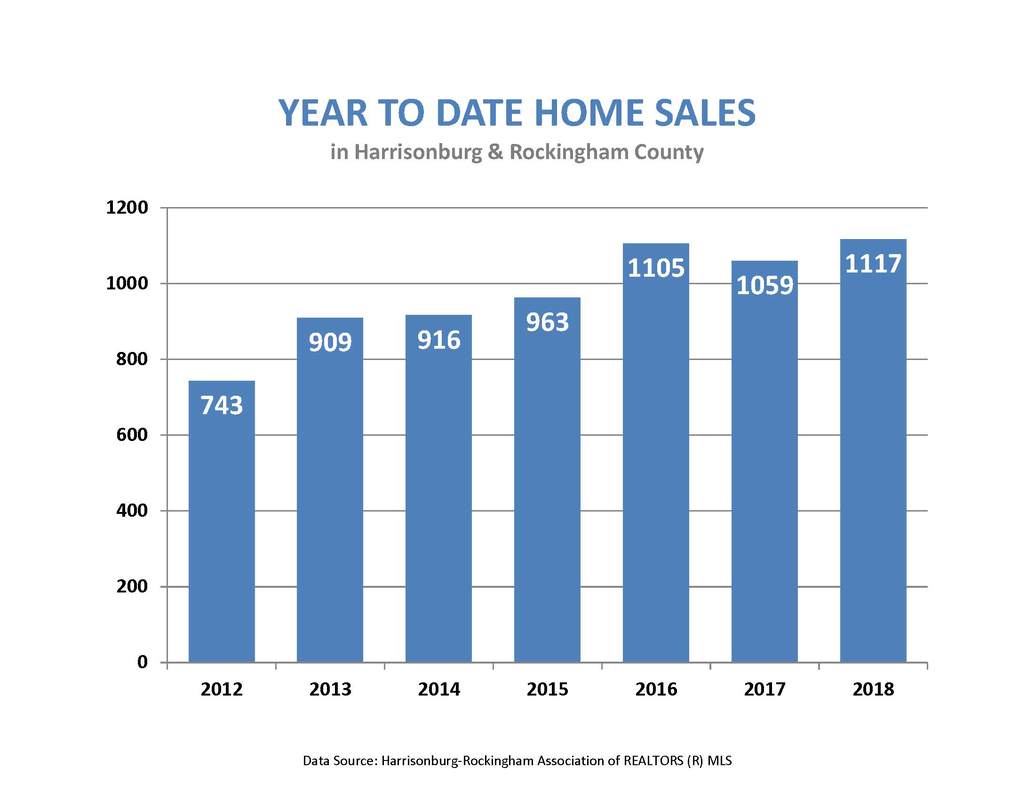
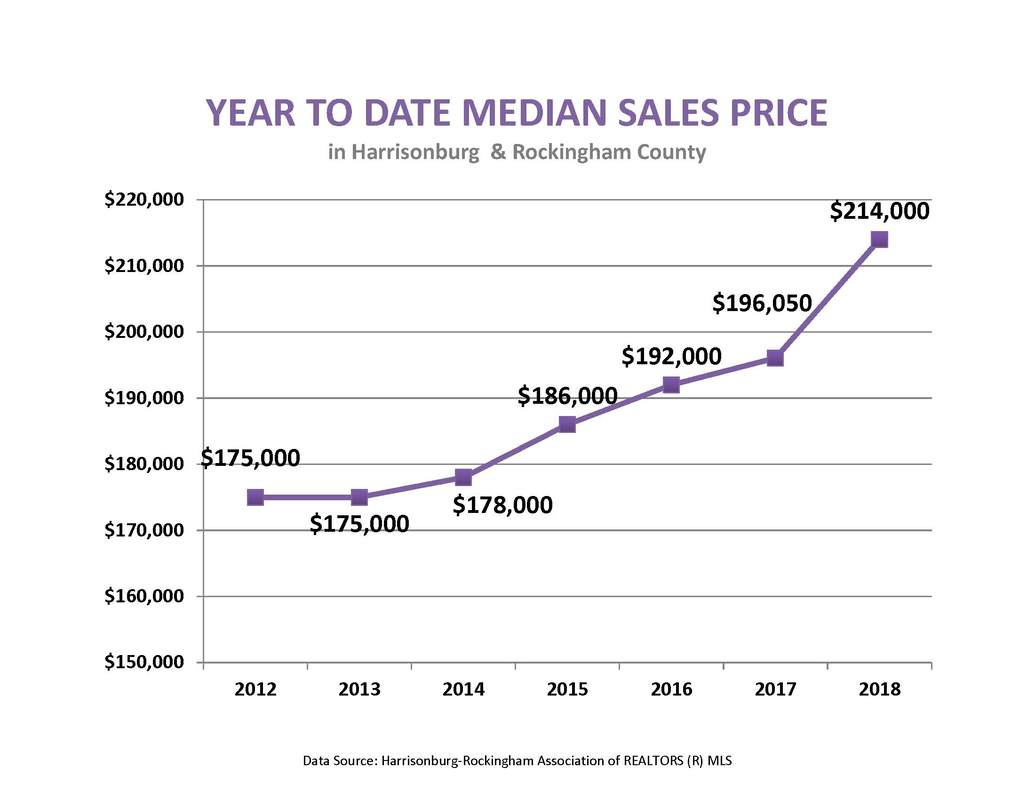
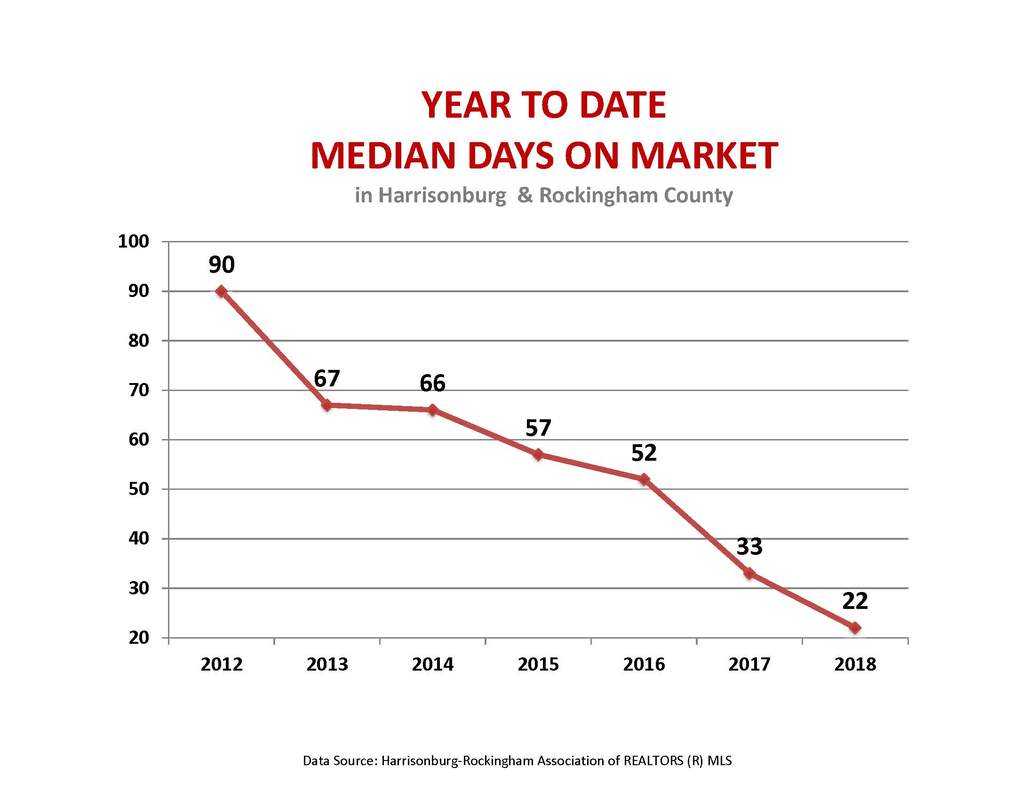
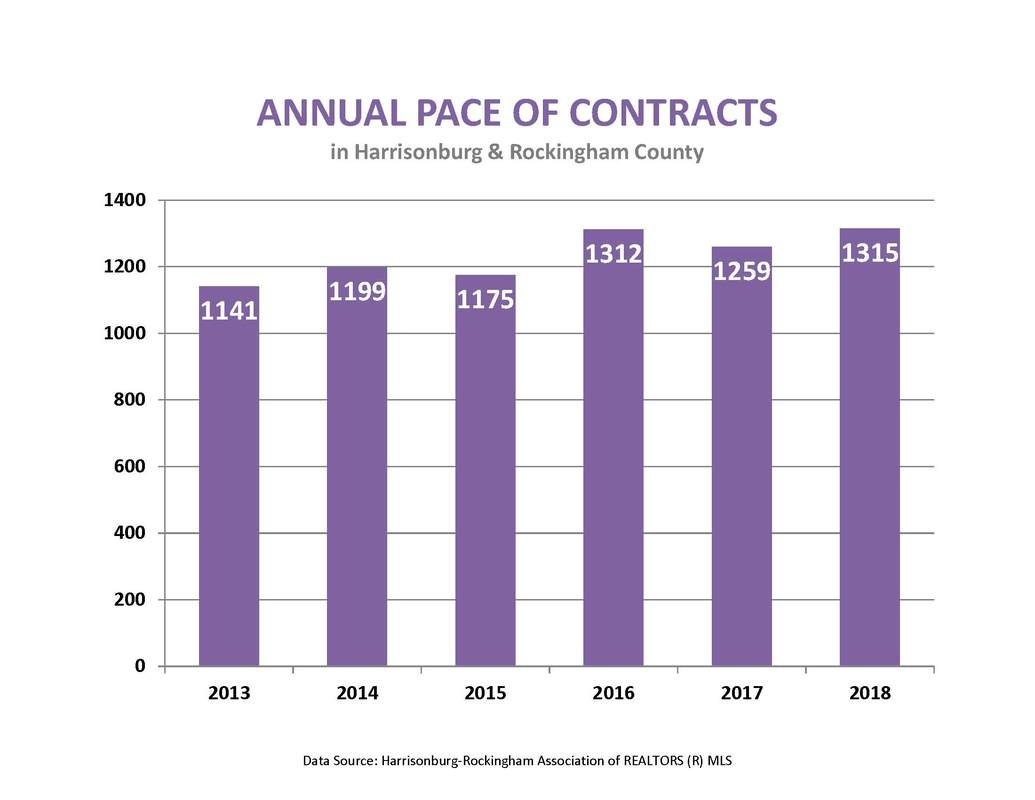
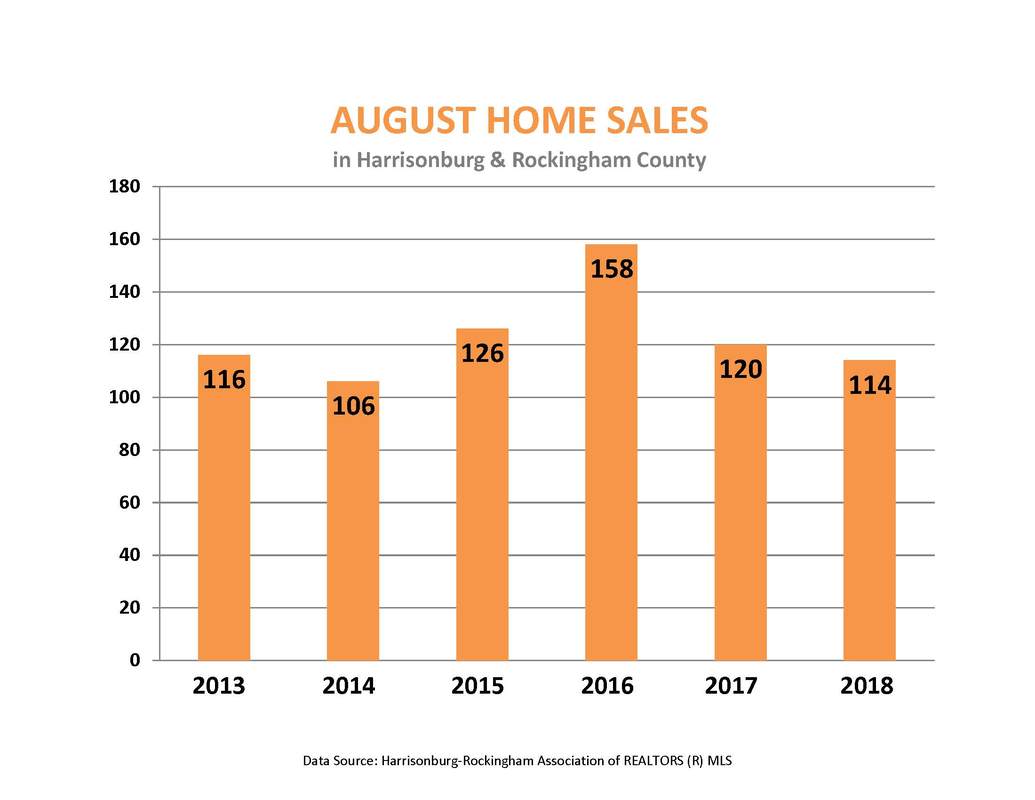
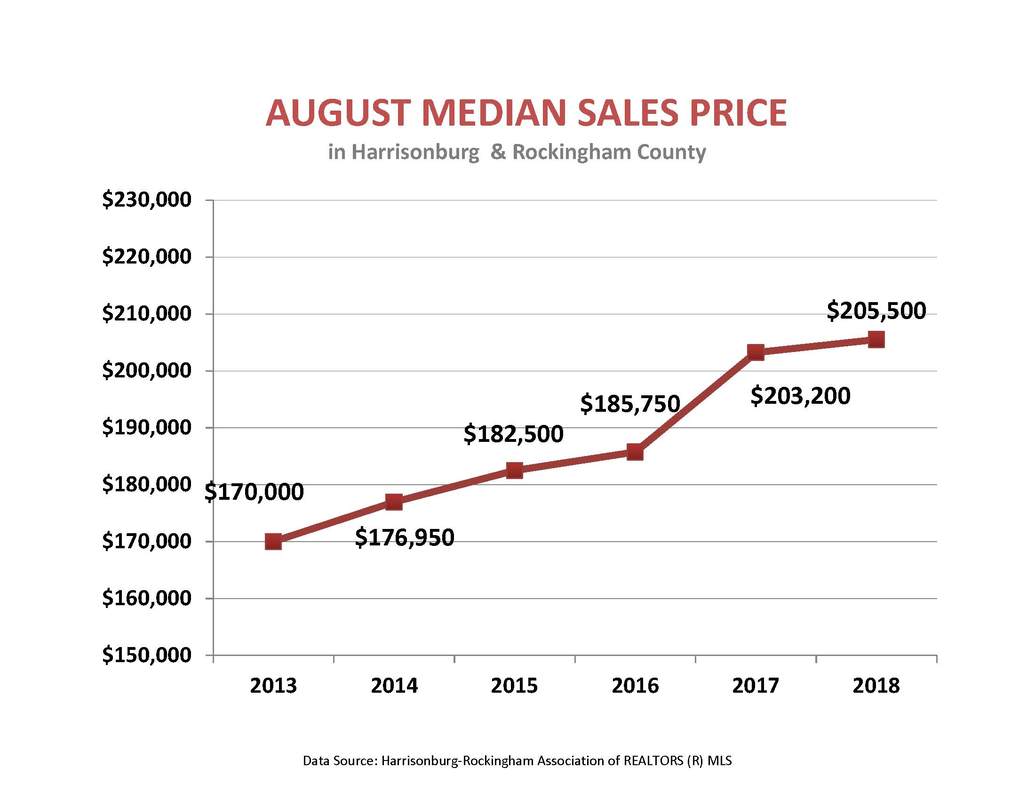
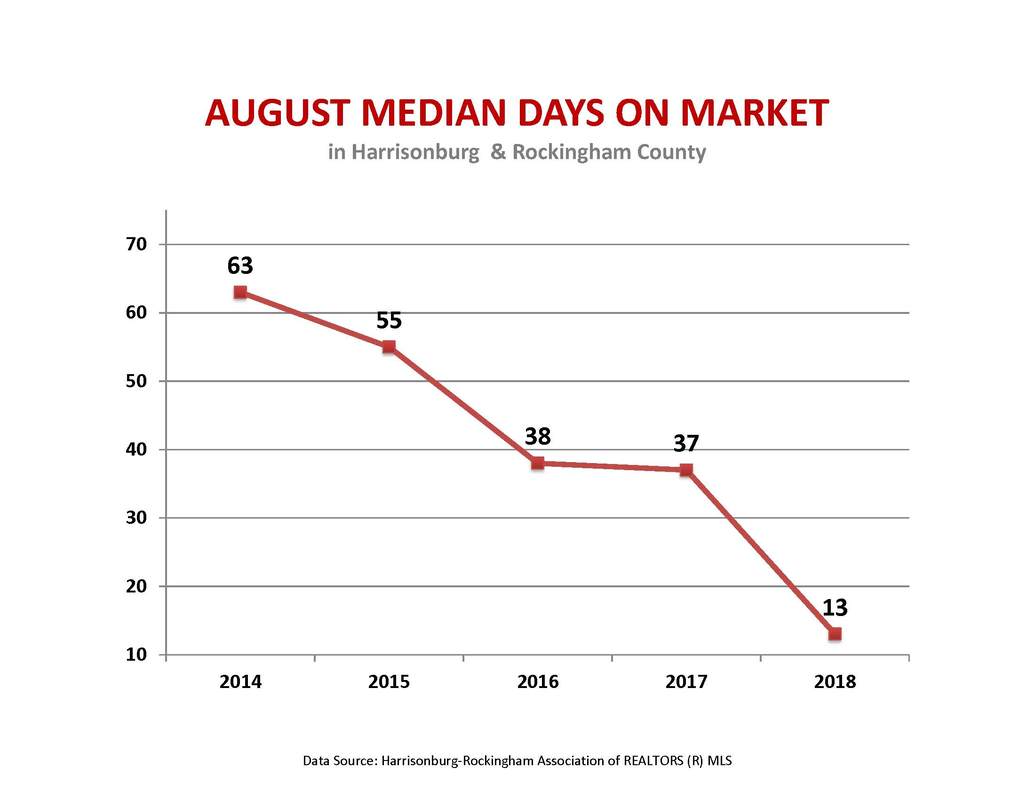
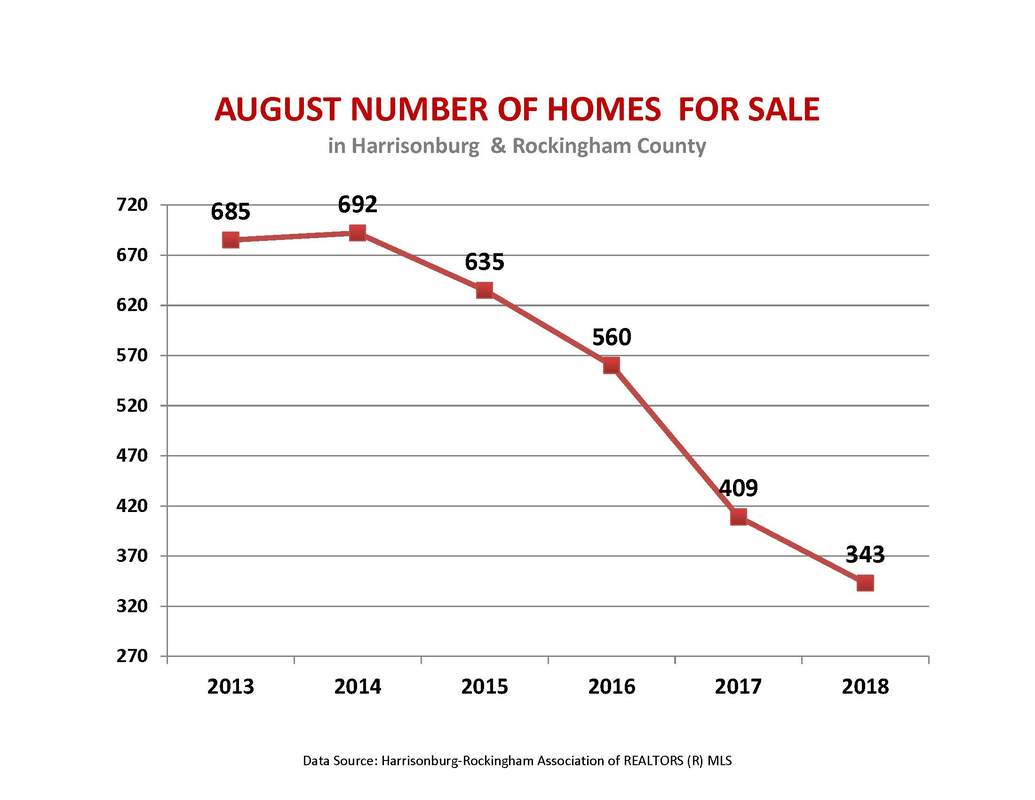
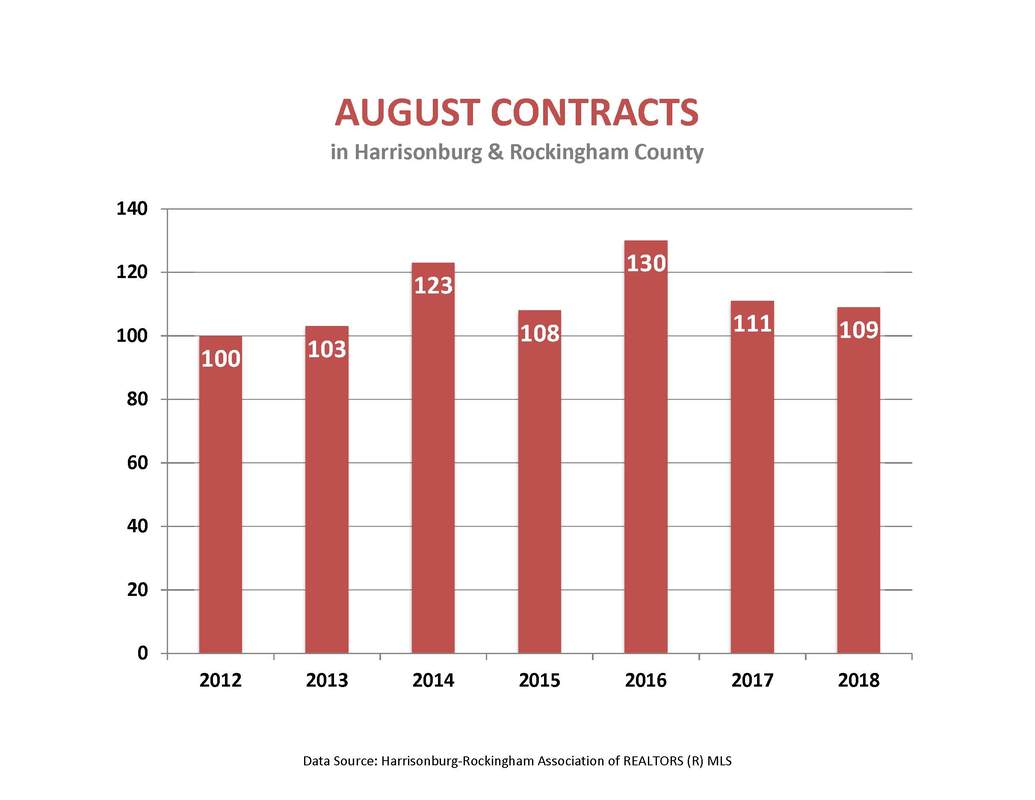
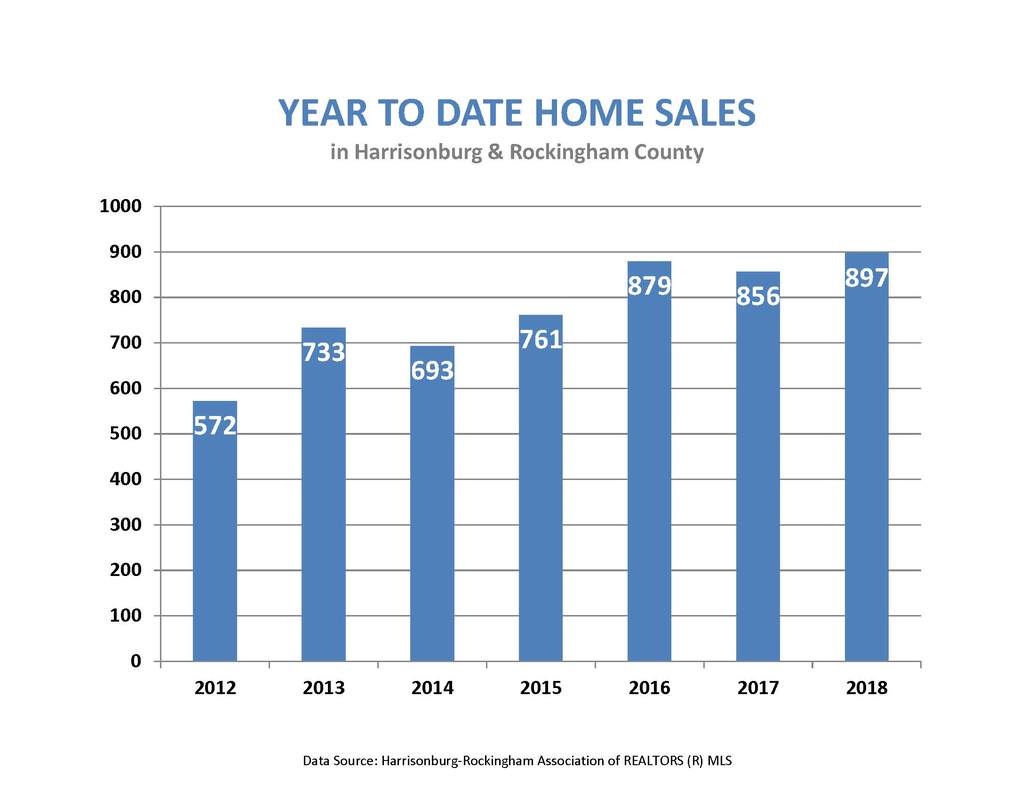
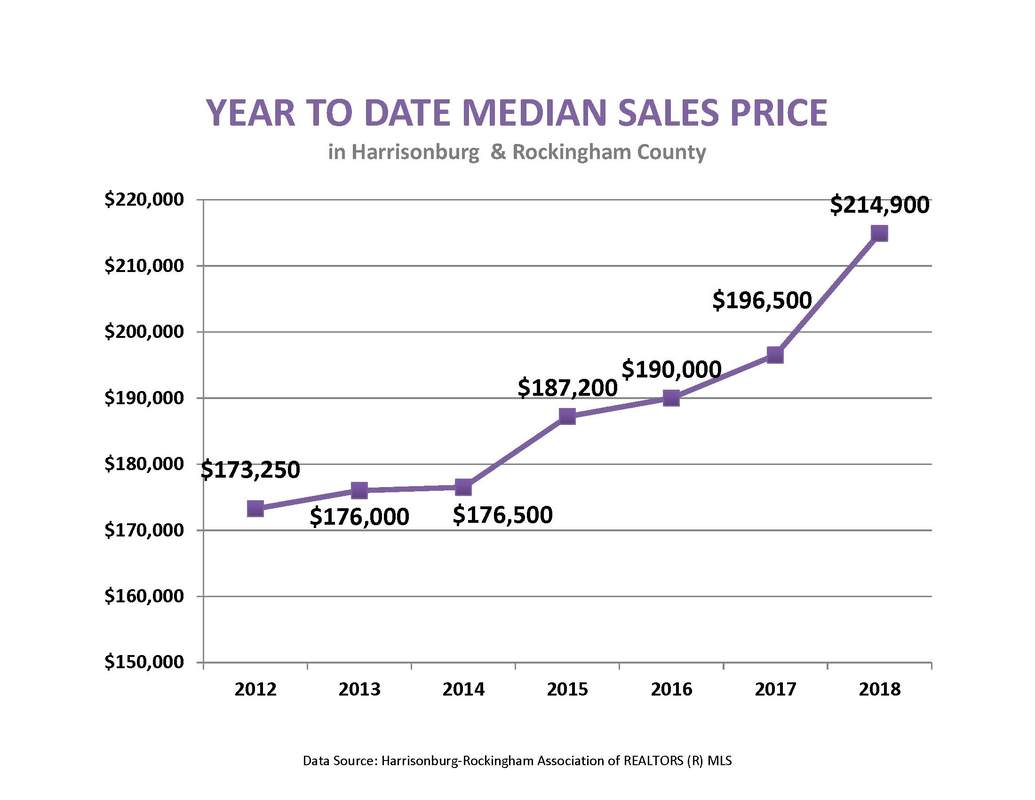
So, how was the year statistically? Pretty good! We beat last year as far as the number of homes that were sold. However, we didn't beat 2016 in volume. The lack of inventory is not drastic when compared to 2017, but if you go back to 2015 it is dramatic. The decline in the number of houses for sale from 2015 are likely part of the reason the median sales price has been going up more quickly than average appreciation. It will be interesting to see if these trends continue into 2019. We are certainly still seeing quick sales and low inventory. After seeing a slight dip in sales in September, October has come back with a vengeance. There were 18% more sales when comparing October of 2018 to 2017. Furthermore, the median sales price is up, and the median days on the market is down. These statistics are likely still driven by the fact that there are still not enough homes on the market. Home buyers less than half the amount of homes to choose from now then they would have in 2015 in October. While we are hitting the winter months, these statistics still indicate it's a strong time to sell your house. The higher number of contracts signed in July 2018 than in July 2017 did not correlate to a higher number of sales in August 2018 (compared to August 2017). Click here for las month's analysis. This could mean that a higher number of contracts were terminated but it could also mean that we had a longer closing time frame and will close next month.
Overall, we are still in a seller's market. If you are thinking of listing your home, it is still a good time. If you are thinking of buying a house, it's a good idea to be prepared to move quickly and be competitive if you find a house you like. Click here to read more about preparing yourself for a competitive house. |
Categories
All
|


 RSS Feed

|
Email - Click Here
Phone - 540-246-9067 Website - www.mattiasclymer.com Schedule a Meeting, Download Contact Card, Etc... |
Funkhouser Real Estate Group | 401 University Boulevard, Harrisonburg, VA 22801 | 540-434-2400 | ©2021 | Privacy Policy | All rights reserved.
Licensed in the Commonwealth of Virginia